This volume provides a tutorial review and evaluation of scientific research on the accuracy and reliability of eyewitness identification. The book starts with the perspective that there are a variety of conceptual and empirical problems with eyewitness identification as a form of forensic evidence, just as there are a variety of problems with other forms of forensic evidence. There is then an examination of the important results in the study of eyewitness memory and the implications of this research for psychological theory and for social and legal policy. The volume takes the perspective that research on eyewitness identification can be seen as the paradigmatic example of how psychological science can be successfully applied to real-world problems.
eBook - ePub
The Psychology of Eyewitness Identification
- 346 pages
- English
- ePUB (mobile friendly)
- Available on iOS & Android
eBook - ePub
The Psychology of Eyewitness Identification
About this book
Trusted by 375,005 students
Access to over 1.5 million titles for a fair monthly price.
Study more efficiently using our study tools.
Information
1
C H A P T E R
Twenty-Seven Years
Twenty-seven years is an awfully long time. Twenty-seven years ago one of us was still in graduate school (AC), one of us was just out of high school (JL), and one of us had just had his bar mitzvah (JN). The Soviet Union was still considered the United States’ chief nemesis, and Ronald Reagan was president of the United States. Twenty-seven years ago IBM had just released its XT personal computer, which came with a whopping 128 kB of memory and a floppy disk drive to boot. The World Wide Web was not yet invented, and cell phones were in their infancy. There was no Facebook. There was no Farmtown. There was no Wii.
In 27 years, a young adult, just out of high school, goes through a series of milestones that may include going to college, starting one’s career, forming new friendships, travel, courtship and marriage, parenthood, and many other changes. One’s hair can fall out. Or it can turn gray. In the United States, the average person lives 78 years (World Bank, 2010). Twenty-seven years is more than one third of the typical person’s life and close to one half of the typical person’s adult life.
For Michael Green, 27 years was the time of his longest nightmare (Solano, 2010). Back in 1983, four men abducted and sexually assaulted a woman in Houston. The men got away after a police chase, and investigators immediately started canvassing the area. They stopped males who matched the general description of the perpetrators and showed them to the victim to see if she could identify them. When Michael Green was stopped and shown to the victim, shortly after the crime, she failed to identify him as one of her attackers. But the police did not stop there. A week later, the victim was shown a photographic lineup that included a picture of Michael Green, as well as pictures of several other men. When the victim saw the lineup, she identified Green, even though a week earlier she had not. Later on, Green was put in a live lineup and shown to the victim again. She identified him again. At trial she indicated that she was absolutely certain that Green was her attacker. Based on her identification, Green was convicted and sentenced to 75 years in prison.
There were a number of reasons to be concerned about the victim’s identification in this case. For one thing, shortly after her attack, when her memory was freshest, the victim failed to identify Green as her attacker. Then, a week later, when her memory was presumably less fresh, she did identify Green. Additionally, Green was shown to the victim multiple times, once shortly after the assault, once in a photo lineup a week later, then a bit later in a live lineup. This identification procedure is bound to lead to problems, because it makes it obvious to the witness who the police suspect of the crime. It may also result in an elevated feeling of familiarity with the suspect’s face.
Despite problems with the identification procedure, the jury convicted Green. Unfortunately, the jury was mistaken. In 2010, new DNA tests were ordered in Green’s case, and he was exonerated. An innocent man, he had spent 27 years of his life in prison. While in prison, his mother had died. He was not able to go to her funeral. Michael Green will never get those 27 years back.
To date, there have been 258 DNA exoneration cases in the United States (Innocence Project, 2010). That’s 258 and counting. In the average case, the person exonerated spent 13 years in prison before being released. In 70% of the cases, the person exonerated was a member of a racial or ethnic minority group. Importantly, for the present book, a mistaken eyewitness identification was a contributing cause in more than 75% of these wrongful convictions (see Figure 1.1). Of the cases involving mistaken eyewitness identifications, more than one third of cases involved two or more witnesses making the same mistaken identification.
FIGURE 1.1 Contributing factors in the first 225 DNA exoneration cases. Percentages sum to more than 100% because in some cases more than one factor was involved.

(Source: Based on data obtain from The Innocence Project at the Benjamin N. Cardozo School of Law at Yeshiva University, http://www.innocenceproject.org/understand/; clip art used to create the image obtained from the Open Clipart Library, http://www.openclipart.org; clip art image drawn by Johnny_automatic.)
The 258 DNA exoneration cases likely represent the tip of the iceberg when it comes to wrongful convictions. About three quarters of DNA exoneration cases involve sexual assaults (Gross, Jacoby, Matheson, Montgomery, & Patel, 2005). This is because biological evidence is more likely to be available in sexual assault cases than in other types of cases. As eyewitness researcher John Tuttle put it, “Unless the guy robbing that 7-11 store gets pretty damned excited, he’s not going to be leaving behind any biological fluids” (cited by Wells, n.d.-a). Without available biological evidence, there may be no way for individuals convicted of other types of crimes to establish their factual innocence. Given that rapists make up only 10% of the state prison population in the United States—and only one third of those cases involve sexual assaults by strangers—it has been estimated that the number of undetected wrongful convictions in the United States numbers in the thousands (Gross et al., 2005).
□ The Science of Eyewitness Identification
The science of eyewitness memory has been around for more than a century and in the past 30 years has produced a wealth of important findings that can be used by social policy makers to improve the criminal justice system. The focus of this book is on those variables that impact eyewitness identification accuracy. We are interested in cases where police show a witness one or more people and ask the witness to make an identification. There are different procedures that police can use in order to see if a witness can identify a suspect. For instance, in Michael Green’s case, the first identification attempt involved a procedure called a showup. A showup is an identification procedure in which a witness is shown a single suspect and is asked if this is the person who committed the crime. Showups can be conducted live, as in Michael Green’s case. These are sometimes called corporeal showups. Showups can also be conducted by showing the witness a photograph of the suspect. These are called photographic showups.
The second time the victim saw Michael Green, he was in a lineup. In a lineup, a witness is shown multiple people (often six) and is asked to indicate which individual, if any, committed the crime. A good lineup should have a single suspect and a number of foils (commonly five; foils are also sometimes called fillers or distracters). The suspect is the person who the police think might have committed the crime. The foils are known to be innocent, although they match the general description of the culprit. Foils are used to protect innocent suspects. If the lineup procedures are fair (see Chapters 2 and 4) and the suspect is innocent, a witness who makes a mistake is more likely to pick one of the foils than he or she is to pick the suspect.
Lineups can be conducted live or with a set of photos. Live lineups are sometimes called corporeal lineups, and photographic lineups are sometimes called photoarrays. In the United States, photoarrays are often made up of six pictures, arranged in two rows of three photos. These are sometimes informally referred to as six packs. In the United States, photoarrays are far and away more common than corporeal lineups (Fulero & Wrightsman, 2009). One reason for this is that it is typically much easier to put together the lineup when all you need to do is find photographs of foils who match the description of the culprit, as opposed to finding live people who match the description of the culprit. Additionally, under U.S. law, suspects in corporeal lineups have a right to counsel, whereas suspects in photoarrays do not (United States v. Ash, 1973).
For the most part, research psychologists study eyewitness memory by conducting experiments. In a typical eyewitness experiment, participants view a mock crime that may be in the form of a videotaped re-creation or a slide presentation, or may be staged live. In some experiments, participants are deceived into believing an actual crime has occurred (e.g., theft of a computer). In other experiments, participants know all along that it is just a simulation of a crime. Following the mock crime, there is usually a retention interval. The retention interval is simply the time that passes between the event and the attempted identification. Following the retention interval, the participants may be shown a lineup (or showup) and asked to make a decision. For half the participants, the lineup includes the person who committed the crime. This is called a target-present lineup. Target-present lineups mimic the situation where the police have a suspect, and the suspect is in fact guilty of the crime. For the other half of the participants, the lineup does not include the person who committed the crime. This is called a target-absent lineup. Target-absent lineups are meant to mimic the situation where the police have a suspect, but the suspect is in fact innocent of the crime. The advantage of using experimental techniques such as these is that they allow researchers to examine how accurate witnesses are under varying conditions. The researchers can measure the number of correct identifications of the suspect in the target-present lineup and the number of mistaken identifications of the suspect in the target-absent lineup and see what factors influence accuracy.
To give just one example, consider a clever study by Pigott, Brigham, and Bothwell (1990). They obtained the cooperation of bank managers at a number of different banks to conduct the study. At each bank, a volunteer entered the bank, went to the island where people fill out their deposit slips, and then went up to a teller and tried to cash an obviously forged postal money order. The money order was a $10 money order with an extra “1” written on it in ink so that it said $110. All the tellers who were approached in this way refused to cash the money order. The volunteer then acted irritated, took the money order back, and left the bank. The tellers informed their supervisors, and a few hours later a researcher posing as a plainclothes detective interviewed the tellers and showed them photoarrays that either included the culprit or did not include the culprit. The lineups had been constructed for the researchers by an actual police detective. When the tellers were shown the target-present lineup, the suspect was identified about half of the time. When the tellers were shown the target-absent lineup, an innocent person was mistakenly identified close to 40% of the time. Keep in mind that the tellers in this experiment thought that a real crime had occurred and that they were being interviewed by a real police officer.
In the past 30 years, hundreds of studies of eyewitness identification have been conducted. These studies shed light on the factors that can influence eyewitness accuracy. More importantly, the studies have had an impact on police practice, training, and policies (Wells et al., 2000). In the present book, we will be discussing some of the most important variables that have been identified by eyewitness researchers.
□ The Scope of the Problem
How big of a problem is mistaken eyewitness identification? There is no way to know for sure. According to survey research, eyewitness evidence plays a critical role in at least 77,000 criminal cases per year in the United States (Wells et al., 1998). Archival studies of actual eyewitness identification attempts have found that witnesses falsely identify foils around 20% of the time (Valentine, Pickering, & Darling, 2003). This number likely underestimates the number of foil identifications, because police sometimes record foil identifications by simply noting that the suspect was not identified (Wells, n.d.-a). This means that at least one out of five identification attempts results in the selection of an innocent person. If real witnesses to real crimes make the mistake of picking innocent foils, then real witnesses to real crimes undoubtedly also make the mistake of picking innocent suspects. After all, from a witness’s point of view, an innocent foil and an innocent suspect are functionally equivalent (neither is the culprit).
In an attempt to provide a more precise answer to the question of how often witnesses identify innocent suspects, Levi (1998) derived an estimate of the probability that a suspect is guilty, given that the suspect has been chosen from a lineup, by using insights from probability theory (i.e., the Bayes theorem). First, consider a simplified case, where half of all lineups contain a guilty suspect and half of all lineups contain an innocent suspect (i.e., in the real world, there are just as many target-present and target-absent lineups). Statisticians would say the base rate for guilt is 50% and would denote it by saying p(G) = .50. Assuming that base rate, Levi pointed out that the probability of guilt, given that a suspect is chosen from a lineup, can be given by the following simplified version of the Bayes theorem:
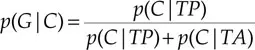
In this equation, p(G|C) (is the probability that the person is guilty given that they were chosen from a lineup, p(C|TP) is the probability of choosing a suspect from a target-present lineup, and p(C|TA) the probability of choosing a suspect from a target-absent lineup. Based on values taken from a number of published peer-reviewed studies, Levi estimated the probability of choosing the suspect from a target-present lineup was about 44% and the probability of choosing the suspect from a fair target-absent lineup was about 9.17%. So putting those values back into the equation, one gets the following:
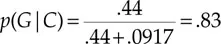
So if Levi’s assumptions are correct, about 83% of the suspects identified from lineups are guilty and about 17% are innocent. That’s quite a startling conclusion: Levi’s calculations suggest that 17% of the suspects identified from lineups are innocent!
This value, of course, is just an estimate and depends on whether the right values were used for p(G), p(C|TP), and p(C|TA). Levi argued that the estimate is probably a conservative estimate. First, Levi argued that actual witnessing conditions are usually not as good as they are in laboratory studies. Thus, the actual value of p(C|TP) is probably less than 44% and the value of p(C|TA) is probably more than 9.17%. Second, the value given for p(C|TA) assumes that fair lineup procedures were being used, but this is not always the case in real life (see Chapters 2 and 4). Thus, p(C|TA) may be even higher. Levi argued that these considerations suggest that the actual rate of mistaken suspect identifications might be more than 17% in real-world lineups.
The estimate provided by Levi also depends heavily on the base rate of guilt. The base rate indicates what percentage of all police lineups actually includes a guilty suspect. You can see why base rates matter. If the base rate of guilt was 100%, then all suspect identifications would be correct identifications, even if witnesses made their decisions by rolling a six-si...
Table of contents
- Cover
- Halftitle
- Title
- Copyright
- Contents
- Acknowledgments
- About the Authors
- 1. Twenty-Seven Years
- 2. Theoretical Approaches to Eyewitness Identification
- 3. Estimator Variables
- 4. System Variables
- 5. Indicia of Reliability
- 6. Field Studies of Eyewitness Identification
- 7. Expert Testimony
- 8. Conclusions and Thoughts
- 9. Philosophical Afterword: Memory and Reasonable Belief
- References
- Author Index
- Subject Index
Frequently asked questions
Yes, you can cancel anytime from the Subscription tab in your account settings on the Perlego website. Your subscription will stay active until the end of your current billing period. Learn how to cancel your subscription
No, books cannot be downloaded as external files, such as PDFs, for use outside of Perlego. However, you can download books within the Perlego app for offline reading on mobile or tablet. Learn how to download books offline
Perlego offers two plans: Essential and Complete
- Essential is ideal for learners and professionals who enjoy exploring a wide range of subjects. Access the Essential Library with 800,000+ trusted titles and best-sellers across business, personal growth, and the humanities. Includes unlimited reading time and Standard Read Aloud voice.
- Complete: Perfect for advanced learners and researchers needing full, unrestricted access. Unlock 1.5M+ books across hundreds of subjects, including academic and specialized titles. The Complete Plan also includes advanced features like Premium Read Aloud and Research Assistant.
We are an online textbook subscription service, where you can get access to an entire online library for less than the price of a single book per month. With over 1.5 million books across 990+ topics, we’ve got you covered! Learn about our mission
Look out for the read-aloud symbol on your next book to see if you can listen to it. The read-aloud tool reads text aloud for you, highlighting the text as it is being read. You can pause it, speed it up and slow it down. Learn more about Read Aloud
Yes! You can use the Perlego app on both iOS and Android devices to read anytime, anywhere — even offline. Perfect for commutes or when you’re on the go.
Please note we cannot support devices running on iOS 13 and Android 7 or earlier. Learn more about using the app
Please note we cannot support devices running on iOS 13 and Android 7 or earlier. Learn more about using the app
Yes, you can access The Psychology of Eyewitness Identification by James Michael Lampinen,Jeffrey S. Neuschatz,Andrew D. Cling in PDF and/or ePUB format, as well as other popular books in Psicología & Psicología cognitiva y cognición. We have over 1.5 million books available in our catalogue for you to explore.