The growth and persistence of government budget deficits is causing increasing concern in both developed and developing countries. They have provoked extreme responses: some economists hold that they have devasting effects, others that they have no real impact at all.
Budget Deficits and Economic Activity in Asia examines both of these claims in the context of the Asian economies. After testing for the feasibility of the current levels of budget deficits and therefore of the current fiscal policies, the author turns to a quantification of the effects on money supply, inflation, aggregate demand and interest rates. The findings for the ten countries studied are far from uniform, but neither of the extreme positions is vindicated. Budget deficits are monetized to a considerable extent, thus impairing or at least reducing the ability of the monetary authority to pursue an independent monetary policy.
The widespread view that budget deficits are inflationary because they increase the money supply receives only partial support. The apparent effects on interest rates appear to be positive and as the processes of fiscal deregulation accelerate, interest rates seem set to become even more sensitive to the behaviour of budget deficits.
Countries covered include India, South Korea, Thailand and Taiwan.
- 224 pages
- English
- ePUB (mobile friendly)
- Available on iOS & Android
eBook - ePub
Budget Deficits and Economic Activity in Asia
About this book
Trusted by 375,005 students
Access to over 1.5 million titles for a fair monthly price.
Study more efficiently using our study tools.
Information
1 A review of the record
As a preliminary to the quantitative analysis to be undertaken in the subsequent chapters, this chapter briefly reviews the recent history of the budget deficits and the government debt in the countries of our sample. This is done by examining the recent trends in nominal deficits and its components, followed by a study of the behaviour of expenditure and revenue, along with their structure, to shed some light on the causes of the observed trends in the deficits. Since the nominal deficits are not the most appropriate concept for economic analysis, the real deficits are then examined. This is followed by a look at the history of the public debt which, of course, reflects the history of commulated budget deficits.
Having discussed the trends in government deficits and debt, we undertake a brief review of the data on deficits in conjunction with the variables of major interest in this study. This kind of review, while not necessarily being a proof of the direction of causality between deficits and the variable concerned, can nevertheless shed interesting light on the hypotheses to be tested subsequently. Clearly, if certain general patterns were to emerge from this review, they will need explaining.
NOMINAL DEFICITS AND THEIR COMPONENTS
Before proceeding with this review, a word is in order about the data used. The data on the deficits and their components as well as the debt are all derived from various issues of Government Finances and the rest of the variables from International Financial Statistics, both published by the International Monetary Fund. The concept of the government deficits used is the national income and accounts one. That this concept may suffer from some measurement problems is by now well recognized (see, for example, Boskin 1988, and Eisner and Pieper 1984, among others). But given the large number of countries in our sample, and the lack of availability of individual country primary sources, it is virtually impossible to make any meaningful corrections. In any event, as a first approximation, the NIAC concept is not a bad start. Similarly, the data on public debt also may not be the best measure, either. This is because the measure we use is based on the par value of the debt rather than the market value, which is the more appropriate one. But once again, such data for the countries in this study are simply not available. However, one advantage of the data which are being used is that they are measured by a uniform methodology and to that extent facilitate inter-country comparisons, which is the major focus of this study.
The time period covered in this study was determined by the availability of the data on deficits, its components, and the other major variables.
We can now turn to a review of the record. The recent history of the nominal and the real budget deficits is shown in Figure 1.1. Concentrating on the nominal deficits first, we can see from this figure that the nine countries did not have a uniform experience during the sample period. To take the two extreme examples, Singapore and Sri Lanka; whereas Singapore experienced budget surpluses for most of the period, Sri Lanka, on the other hand, shows high and rising deficits. In between we can see less extreme though still differing experiences. In order to highlight these similarities and dissimilarities more sharply, we can look at Table Table 1.1 which gives the levels of nominal deficits as a percentage of GDP for different time periods.
This table highlights a number of points. The first thing to note is that for India, South Korea, Malaysia, the Philippines, Sri Lanka and Thailand, the experience from the mid-1970s onwards differs significantly from the period before that. More specifically, the levels of nominal deficits (again as percentages of GDP) are higher than before. And even within this decade, the deficits were higher in the first half of the 1980s than the latter half of the 1970s. For the other three countries, there are no such similarities. Thus for Indonesia the deficit falls in the late 1970s, then rises. Pakistan’s experience is just the opposite of Indonesia. Its deficit falls in the early 1970s, then rises in the late 1970s, followed by a sharp decline in the early 1980s. Singapore stands in a class by itself. Except for the period 1961–65, it shows a budget surplus, although there is considerable variability over time. Apart from these similarities anddifferences in the trends, the absolute magnitudes of the percentage of the deficit also differ widely. Thus, leaving aside Singapore, during 1981–85 the figure was as low as 1.18 per cent for Indonesia and as high as 13.87 per cent for Sri Lanka. In general, using below and above 5 per cent as the dividing line between low and high deficit economies respectively, we can see that for the decade of 1976–85 Indonesia, South Korea, the Philippines, Thailand, and, of course, Singapore fall into the low deficit category and the rest into the high deficit category.
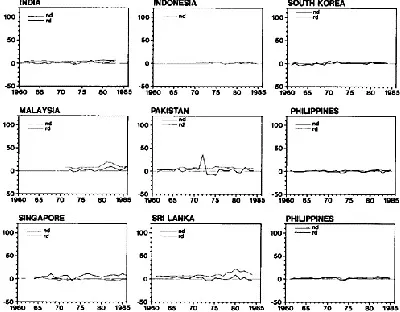
Figure 1.1 Nominal and real federal deficits as percentage of GDP
A point was made above about the differing degrees of variability in the experiences of the nine countries. A better way to consider this aspect is to look a Table 1.2, which gives variances of the nominal and the real deficit rates. It is immediately clear that only Malaysia and Sri Lanka show the greatest variance in nominal deficits.
In order to highlight the role of public debt in the budget deficits, it is useful to distinguish between primary deficits and interest payments on public debt. Total deficits considered above, of course, equal the sum of these two components. The point is that unless the interest payments on outstanding government debt are, at least, balanced by a primary surplus, there will always be a budget deficit. In order to bring out the significance of this distinction for the nine countries, we present some recent data on these components and the total deficit. These data are given in Table 1.3.
Table 1.1 Nominal and real deficits as percentage of GDP*
This table again shows important inter-country differences. For example, in the 1980s, budget deficits in India, Indonesia, Malaysia, Pakistan and the Philippines largely reflect interest payments on public debt. On the other hand, the deficits in Sri Lanka and Thailand were compounded both by primary deficits and interest payments. The importance of the distinction between these two components will be brought out further in the next chapter when we examine the sustainability issue.
Table 1.2 Variances of nd and rd
NOMINAL DEFICITS, EXPENDITURE AND REVENUE
The trends in nominal deficits discussed above reflect the trends in government expenditure and revenue. It is not our intention to carry out a detailed analysis of the factors underlying the deficits or to examine in detail the expenditure and the revenue policies of the nine governments. That is a task beyond the scope of any study such as this. However, the aim is to consider the general trends in expenditures and revenues and in particular, consider evidence of some popular perceptions about the causes of the observed deficits. It is often alleged that in developing countries some of the major causes of these deficits on the expenditure side are the expenditures on ‘non-developmental’ items like subsidies, defence and administration. On the revenue side the main problem is the relatively small tax base and therefore relative stagnation in the share of direct taxes as a source of revenue. The discussion below is meant to shed some light on these factors.
The broad trends in total expenditures and revenues over the period are presented in Figure 1.2. These figures are self-explanatory, except for the fact that once again we notice considerable differences in the experiences of the nine countries. However, one similarity is quite noticeable, namely, that for most of the period, the two move together. To get a better insight, we consider Tables 1.4 and 1.5 which provide a more detailed analysis of the two aggregates for the recent period.
Considering Table 1.4 first, we concentrate on expenditure on goods and services, fixed investment, interest payments, subsidies and defence. Comparing 1974 with the latest year for which the data are available, we can draw a number of conclusions. The expenditure on goods and services rose for South Korea, Malaysia, Pakistan, Sri Lanka, and Thailand, whereas the expenditure on fixed investment declined in India, Malaysia, and Sri Lanka. Thus there is suggestive evidence of crowding out of fixed investment expenditure by government consumption expenditure in the cases of Malaysia and Sri Lanka. But in general, the expenditure on goods and services either remained constant or rose for all the countries, whereas the expenditure on fixed investment remained constant or rose for six of the nine countries. Interest payments as a percentage of GDP rose for all countries. Interestingly enough, subsidies and other transfer payments show a rising tendency for only two countries, India and South Korea. In terms of expenditure on defence, rising trends can be noticed in the cases of South Korea, Malaysia, Pakistan, Singapore, Sri Lanka and Thailand. From this brief discussion, it is clear that one of the major reasons for the observed deficits was the rising cost of servicing the government debt and in the case of six countries, also expenditures on defence. But the support for the widely held belief that subsidies and government consumption expenditures were largely responsible does not receive much support.
Next we consider the revenue side. The data for the same time period as those in Table 1.4 are given in Table 1.5. Here we concentrate on the inter-country differences in the value of the ratio of direct taxes to GDP and its trend. Broadly speaking, we can observe two major differences. Countries with low ratio of direct taxes also had a relatively constant ratio, while countries with high ratios had a rising rate, the only exception being Thailand. The first category consists of India, South Korea, Pakistan, the Philippines, Sri Lanka, and Thailand, while the latter category includes Indonesia, Malaysia, and Singapore. What is thus clear is that the relatively small and constant contribution of direct taxes to government revenues, ceteris paribus, also plays a role in generalizing the observed deficits for a number of countries in the sample.
Budget deficits and economic activity in Asia 10 Table 1.3 Components of nominal deficits as percentage of GDP
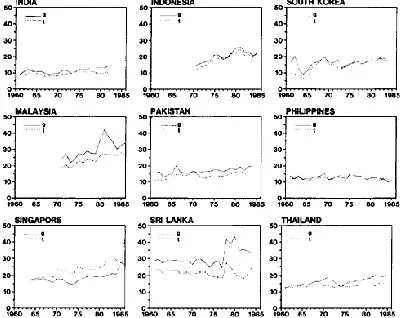
Figure 1.2 Government expenditure and taxes as percentage of GDP
NOMINAL VERSUS REAL DEFICITS
It is well known that nominal budget deficits do not always accurately represent the stance of fiscal policy (King and Plosser 1985 and Masera 1987, among others). A more accurate measure is the concept of real deficits. This requires adjusting nominal deficits for inflation. This can be done by using the budget constraint. The trends in real deficits are shown in Figure 1.1 and its quantitative aspects are given in Tables 1.1 and 1.2. It is clear from Figure 1.1 that real deficits display greater variability than nominal deficits. Also, in many cases deficits in real terms are lower than in nominal terms. We can see the distinction between the nominal and the real deficits more concretely in terms of Tables 1.1 and 1.2. Considering the extreme example, Sri Lanka, where the nominal deficits were the highest from 1976 to 1985, the situation in terms of the real deficits is quite different. Not only is it no longer the extreme case, but in fact in 1981–85 it enjoyed a budget surplus in real terms. The differences in the variability of the two measures are further highlighted in Table 1.2. The variance of the real deficits exceeded that of the nominal deficits for four of the eight countries for the entire sample period. For the period prior to 1974, this was the case for six countries and for the period since 1974, this happened for five countries. In terms of individual countries’ experiences, the variance of real deficits was on the low side for South Korea, the Philippines, and Thailand for the post-1974 period. Other differences can also be read from this table. Finally, we can get a better feel for the relationship between the two concepts of the deficit by considering their correlation coefficient given in Table 1.6. The coefficient is very low, even negative for India, Pakistan, and the Philippines. On the other hand, it has changed remarkably over time for some countries, for example India, South Korea, Malaysia, Sri Lanka, and Thailand. In short, nominal deficits may not always reflect the situation about the real deficits.
It is possible to examine the implications of correcting nominal deficits for inflation further. This can be done by following Masera (1987). In order to carry out his approach, we can rewrite the government budget constraint as follows:
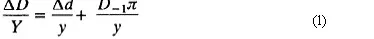
where D is nominal government debt, d is real debt, Y and y are nominal and real GDP respectively, and ð it is the rate of inflation as measured by the rate of change of the GDP implicit price deflator.
In this equation, ÄD/Y represents total government borrowing requirements which equal Äd/y plus (D-1/y)ð, where the first term rep...
Table of contents
- COVER PAGE
- TITLE PAGE
- COPYRIGHT PAGE
- FIGURES
- TABLES
- ACKNOWLEDGEMENTS
- INTRODUCTION
- 1: A REVIEW OF THE RECORD
- 2: SUSTAINABILITY OF PERPETUAL DEFICITS
- 3: DEFICITS AND SEIGNIORAGE
- 4: DEFICITS AND MONEY SUPPLY
- 5: DEFICITS AND INFLATION
- 6: DEFICITS AND AGGREGATE DEMAND
- 7: DEFICITS AND INTEREST RATES
- 8: CONCLUSIONS
- NOTES
- SELECTED BIBLIOGRAPHY
Frequently asked questions
Yes, you can cancel anytime from the Subscription tab in your account settings on the Perlego website. Your subscription will stay active until the end of your current billing period. Learn how to cancel your subscription
No, books cannot be downloaded as external files, such as PDFs, for use outside of Perlego. However, you can download books within the Perlego app for offline reading on mobile or tablet. Learn how to download books offline
Perlego offers two plans: Essential and Complete
- Essential is ideal for learners and professionals who enjoy exploring a wide range of subjects. Access the Essential Library with 800,000+ trusted titles and best-sellers across business, personal growth, and the humanities. Includes unlimited reading time and Standard Read Aloud voice.
- Complete: Perfect for advanced learners and researchers needing full, unrestricted access. Unlock 1.5M+ books across hundreds of subjects, including academic and specialized titles. The Complete Plan also includes advanced features like Premium Read Aloud and Research Assistant.
We are an online textbook subscription service, where you can get access to an entire online library for less than the price of a single book per month. With over 1.5 million books across 990+ topics, we’ve got you covered! Learn about our mission
Look out for the read-aloud symbol on your next book to see if you can listen to it. The read-aloud tool reads text aloud for you, highlighting the text as it is being read. You can pause it, speed it up and slow it down. Learn more about Read Aloud
Yes! You can use the Perlego app on both iOS and Android devices to read anytime, anywhere — even offline. Perfect for commutes or when you’re on the go.
Please note we cannot support devices running on iOS 13 and Android 7 or earlier. Learn more about using the app
Please note we cannot support devices running on iOS 13 and Android 7 or earlier. Learn more about using the app
Yes, you can access Budget Deficits and Economic Activity in Asia by Kanhaya Gupta in PDF and/or ePUB format, as well as other popular books in Business & Business General. We have over 1.5 million books available in our catalogue for you to explore.