1: The bubble era in US stocks
Introduction
When Gordon Gecko pronounced that ‘greed is good’ in the movie ‘Wall Street’ he was probably half-right—but what he forgot to mention was that ‘fear is bad’. American investors not only listened to, but also believed, what Gordon Gecko (1988) stated
Greed, for the lack of a better word, is good. Greed is right. Greed works. Greed clarifies, cuts through and captures the essence of the evolutionary spirit. Greed in all its forms, greed for life, for money, for love, knowledge has marked the surge of mankind and greed, you mark my words, will not only save Teldar Paper but that other malfunctioning corporation called the USA.
There were primal motives at work in driving the explosion of US stock prices throughout the 1990s—whereby greed overwhelmed fear. If there was such a thing as investor fear it was of the wrong kind—the fear of missing out. Such an extended boom has not been matched anywhere in US financial history. Booms in stock prices have occurred before, particularly the golden years of the 1960s and not to mention the euphoric episode of 1928–9, but none quite like the extended run of the late 1990s. However, the stock boom of the 1990s was more than a boom—it resembled a bubble or a euphoria that caused a vast overvaluation of stock prices—that eventually had to burst. Moreover, the bubble was triple headed—as the US bond market and US dollar joined in the euphoria. Unfortunately, there have always been serious, if not devastating, collapses in real activity and job growth in the aftermath of a deflating bubble. Policy-makers and Greenspan in particular, were somewhat dubious of the run-up in US stock prices in the late 1990s as there was an inherent fear that a sudden collapse would cause much disruption to economic activity, human welfare and the retirement plans of ordinary US citizens. Just as the lives of ordinary people were damaged in the 1929 crash, so would a routing of US stock prices cause widespread damage across middle-class America. These fears were partially realized in 2000, as US stocks fell and then collapsed into a three-year bear market. The bursting of the US stock bubble, together with an out-of-favour US dollar, raised fear that a major protracted economic slowdown would follow. There are lessons from Japan’s burst bubble as Japan’s real economy languished for many years after the bubble deflated. We can go back further—just as in the Bible story —when Joseph proclaimed to Egypt that there would be seven fat years followed by seven lean years and so there is an apprehension that America’s euphoric bubble will have to be ‘paid for’ with several lean years—consecutive or not.
This chapter is somewhat backward-looking in that it examines the major origins of the stock bubble. Brokerage houses pushed the historical fact that stocks have been a superior investment over most, if not all, other classes of assets over a long period of time. This is known as the equity premium puzzle. Hence, brokers pushed a ‘buy and hold strategy’ or more precisely a ‘buy and buy’ strategy. Wall Street was depicted as a one-way street and timing was not really that important—just buy and wait—according to the stock pushers. Or ‘buy on dips’ was another strong investment strategy. Another financial concept is also covered, namely Tobin’s Q ratio. When the value of the stock market soars, relative to corporate net worth there is an incentive for companies to invest in relatively cheap physical capital. This substitution effect eventually calls for lower stock prices and the Q ratio to mean revert. This ‘predictive tool’ pointed to a very high Q ratio in the bubble era that served as a warning signal for stock valuations to fall quite significantly. In essence, stocks trade within a corridor—albeit a wide corridor—and eventually self-correct. So we have two competing investment strategies: the buy and hold strategy (a one-way street) and the contrarian strategy (a two-way street) in Wall Street philosophy.
We now know that US stock markets came off their highs in 2000. We also know that such markets have been extremely volatile since 11 September 2001. What we do not know is how well the real economy will recover and whether corporate profits will improve significantly enough to lead a sustainable rally on Wall Street in 2005–6. Much depends on the ability of the real economy to self-correct—pulling stock prices along—or whether stock prices and stock returns mean revert to some kind of long-run average—that is well lower than the peaks of 1999.
By examining the super performance of US stocks this chapter lays the foundations for major analytical themes examined throughout this book.
Origins of the bubble
Just as Great Britain enjoyed a hundred and fifty years of world domination through technological and commercial superiority so has America achieved the same kind of hegemony over the last century. It is the vast accumulation of US wealth that has the latent power to destabilize financial markets and so the real economy, complicating the task of conducting an appropriate stabilization policy. Moreover, economic growth does not infer economic stability. Quite to the contrary, the trade-off between economic growth and macroeconomic stability is still alive and well, despite the high economic cruise speed of the United States in the 1990s. The US Federal Reserve has a mandate to fight inflation and maintain economic stability in an economic system that is prone to fluctuation or in layman’s terms—booms and busts. Why such booms and busts eventuate is still somewhat of a mystery, but the Federal Reserve has to make a value judgment as to whether it should smooth or minimize the effects of the ‘business cycle’. The irony of America’s massive wealth creation of the twentieth century has been associated with instability not only of output and employment but also of asset markets—and stock markets in particular. Speculation in asset markets, have their origins in some kind of monetary liquidity. That is, not just with expansions in the money supply, easy credit policies or margin lending but also with accumulated or stored wealth. It was America’s fat savings pool and vast amounts of capital searching for a home that caused much of its stock market bubble in the 1990s.
Just as Japan experienced a mammoth asset price bubble in the late 1980s due to its massive reserves of accumulated wealth (much of it from exports), so the United States witnessed an asset price bubble of a similar magnitude. The causes are complex, but the vast amount of funds stored in America by both nationals and foreigners is a major perpetrator of the recent asset price bubble. Below are a summary of forces.
Financial forces
- Rapid money supply growth/credit growth
- Foreign capital inflows
- Geopolitical forces
- Margin lending/financial leverage
- Low long-term interest rates
- Low inflation rates
- Lower risk premiums.
Behavioural forces
- Biased capital gain tax laws
- A preference for debt over equity
- Weak corporate governance
- Stock options
- Day trading
- Ponzi games.
Real forces
- Rapid productivity growth
- Expectations of productivity growth
- Expected earnings per share growth.
We shall examine the above causes of the bubble in some detail in Chapter 4. As outlined in this section there are three major driving forces to explain—liquidity, behavioural and real. There is a strong case for arguing that liquidity and behavioural forces dominated the rapid escalation of the stock prices far beyond that can be justified by real forces. The magnitude of this departure from real fundamentals is what a bubble is made of—superficial froth or euphoria—a substance that cannot support airborne stock prices over the long run.
Why the stock bubble?
Real fundamentals could not explain the explosion in US stock prices in the 1990s. Stock prices rose sixfold in this decade while labour productivity only doubled. This large escalation gap can be partially explained by investor behaviour in response to biased economic incentives—although some of this behaviour possessed no base but was indeed pure speculation. What remained as rational investor response was based on tax incentives, generous stock option packages for CEOs, corporate manipulation of profit results, low interest rates, low inflation rates and higher expected productivity growth.
However, financial forces have not been emphasized enough and these include the sizable capital flows into US stock and bond markets, the ‘dollar bubble’, geopolitical forces pushing funds into US markets, high levels of corporate financial leverage, margin lending for investors and the rapid growth in the money supply and credit.
A well-known author such as Schiller (2000) points to this escalation gap as being due to exuberance and behavioural forces that include speculation and greed. As in all bubbles these forces are plausible reasons but the fuel that ignites and allows the speculative fire to rage is that of excessive monetary liquidity and credit growth. Another respectable author such a Siegal (2000) points to changing and biased economic incentives such as the lower taxation of capital, lower risk premiums, a lower dividend payout ratio for holding stocks and lower transaction costs—so much so that stocks are a ‘one-way street’. This book emphasizes the significance of financial forces and foreign capital flows that caused much of the explosion in stock prices— above and beyond that can be explained by raw fundamentals. The remainder of the escalation in stock prices may be attributed to psychological and behavioural forces. It was abundant liquidity that fuelled the speculative fire.
Stocks versus bonds
Hindsight is God’s gift to the economist and so the world. I have just made Mark Haynes of CNBC Squawk Box so very happy! Over a long period of time, stocks have outperformed fixed interest investments. That is, despite wild fluctuations in stock prices and despite uncertainty associated with dividend payments, the rate of return from US stocks has been far higher than those from US fixed interest securities. Acceptance of higher risk derived higher returns from stocks than bonds. However, this superior performance is based on capital gains as well as dividends.
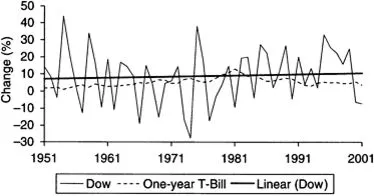
Figure 1.1 Comparing yearly percentage change in Dow and one-year T-Bill rates.
Source: Board of Governors of the Federal Reserve System.
As can be seen from Figure 1.1, the trend line Dow performance (the dark line) has always rested above the nominal interest rate on the one-year treasury bill (T-Bill)— except for a brief period in 1981. Hence, a ‘buy and hold investor’ could effectively borrow funds and hold the Dow portfolio knowing that capital gains would be greater than the one-year T-Bill rate. Moreover, dividend payouts would accrue to such a conservative investor making the overall returns even greater. As will be discussed later, the risk-free alternative to investing in stocks —namely the thirty-year bond—is a major determinant of stock price fortunes. The ten-year bond is also a benchmark alternative.
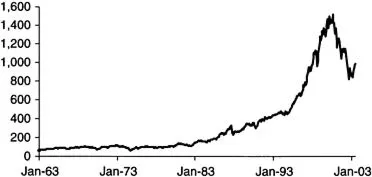
The performance of the Standard and Poors (S&P) index is no less impressive, as can be seen from Figure 1.2. In raw terms the S&P rose from around 40 points in 1960 to around 1,500 points in 2000. These were staggering capital gains even after allowing for inflation. For most years the S&P tracked the Dow and capital gains were similar. We can also see that the S&P collapsed to the very low 800s in early 2003 only to stage an impressive rally by year’s end.
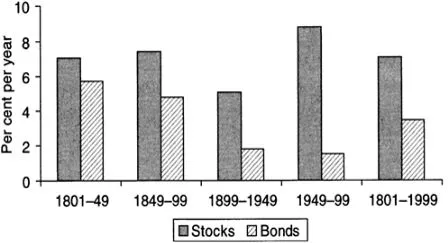
Was the equity premium significant? It was for most part of the last century. Over longer time periods the superior performance of equity returns over bond yields holds true. From Figure 1.3 it can be seen in the period 1949–99 that stock yields were 8.8 per cent while bonds were only 1.5 per cent—a significant premium. Likewise, in the 1899–1949 period stock yields were 5.1 per cent while bond yields were again far lower at 1.8 per cent. Even in the 1800s a lower but still a significant premium existed. According to Siegal (2002) the rate of return from stocks has been around 7.1 per cent since Second World War while real returns from T-Bills and bonds has been around 1 per cent—yielding a premium of more than 6 per cent. This historical fact is a major reason why stockbrokers pushed investors into stocks in the 1990s as they claimed it was a one-way street. Based on Siegal’s research the stocks did out-perform bonds over the long run but not so much in the short run—as bond returns would beat stocks on average two years out of five. So there are times when the risk fearing investor should switch out of stocks and into bonds—even though timing is both difficult and critical.
Figure 1.2 Level of S&P 500 (January 1963-July 2003).
Source: NYSE.
Figure 1.3 Real stock and bond returns.
Source: Siegal (2002) University of Pennsylvania.
So why did stocks outperform bonds for such a long period of time? This ‘paradox’ is known as the equity premium puzzle. Perhaps investors were risk-averse, there was a large degree of unwarranted pessimism by cautious investors, in part driven by the residual fear of the Great Depression. Hence, the fact that needs to be explained is not high returns to stocks but why returns to fixed interest securities were so low. Why did investors underpay for stocks and overpay for bonds? The type of people that invested in stocks (risk-tolerant) are vastly different than those that invested in bonds (risk-averse) and so heterogeneity of investor types might explain why the premium was so high.
So why then has this equity premium shrunk from around 6 per cent in the twentieth century to around 3 per cent or even less in the 1990s? For example, even though the dividend-price ratio for most of the twentieth century was approximately 4.7 per cent, the estimate for the S&P 500 at its 1999 peak was only 1.5 per cent or less. Siegal (2002) claims that the historical 7.5 per cent rate of return included transaction costs, and so when technological advance lowered such costs, the real return required was more like 5 per cent. A different explanation of this puzzle is provided by Hall (2000). He claims that investment in intangible capital has been strong, as US companies positioned in the new global economy have ample funds to expand with, control marketing networks, are backed by the powerful copyright lobby groups and enjoy technological superiority over many international rivals. Forward-looking investors appreciate the strategic plays of US multinationals and are willing to pay a premium to buy into this future globally driven dividend stream. This argument of Hall is both powerful and insightful—it is a far-sighted, big picture view.
This equity premium puzzle became less of a ‘puzzle’ in the late 1990s when the premium disappeared completely. Investors were holding stocks in preference to bonds even when there was no obvious existing premium—as bond yields were higher than dividend yields by anywhere up to 3 per cent. On this basis, the ‘premium’ appeared to be a discount in the late 1990s. Perhaps investors were over-optimistic concerning capital gains? The crash in stocks was inevitable given that bond yields were higher than stock yields for a considerable number of months. After 2000 the risk premium expanded once again.
Absurd valuations
From Table 1.1 it can be seen that P/E ratios (S&P index/EPS $) for the S and P were overstretched at their upward peaks in 1997 (22.2), 1998 (27.7) and 1999 (28.4) in a rising market. In fact, P/E ratios were in their low thirties during some months and even higher for the Dow and NASDAQ. But such ratios retreated slowly in a falling market—such as in 2000 (23.5) but rose again in 2001 (29.5) only to collapse in 2002 (19–1). Earnings from stocks (E%—column 7) remained below the risk free rate on the 10 year bond (Y%—column 8) for most of these years—revealing investor optimism concerning capital gains. However, it should be noted is that the acceleration stock prices cannot persistently run ahead of the growth in earnings per share and Table 1.1 illustrates that. Although stock prices rose by an annual average of 25.7 per cent (column 3) during the boom of 1997–9 the rise in EPS was only an annual average of 8.5 per cent (column 5). Stocks could not and did not justify themselves with this meager rise in the EPS growth. Stock prices had to fall and they did. The market collapsed by an average of—15. 4 per cent between 2000–2 (column 3) while EPS ‘growth’ was a negative—1.23 per cent (column 5). We can s...