- 304 pages
- English
- ePUB (mobile friendly)
- Available on iOS & Android
eBook - ePub
About this book
The consequences of childhood obesity are serious and far reaching, with both physical and psychological components that add to its complexity. Childhood Obesity: Contemporary Issues provides an up-to-date account of the increase of obesity in children, its causes, and its prevention. The expert editorial panel has chosen contributors with consider
Trusted by 375,005 students
Access to over 1.5 million titles for a fair monthly price.
Study more efficiently using our study tools.
Information
Topic
MedicineSubtopic
Nutrition, Dietics & BariatricsPART I
ASSESSING THE SCOPE AND IMPACT OF CHILDHOOD OBESITY
1
CHILDHOOD OBESITY: ASSESSMENT AND PREVALENCE
Tim J. Cole
CONTENTS
Introduction
Definition and Assessment
Changes in Prevalence Over Time
Prediction of Future Obesity
References
INTRODUCTION
The inexorable rise in the prevalence of obesity in adults over the past few decades, followed more recently by a similar rise in children, has been alarming enough in its own right. Accruing evidence has linked obesity to morbidity and mortality from a wide variety of chronic diseases, including heart disease, hypertension, Type 2 diabetes, and most recently cancer, making obesity one of the most serious public health issues of our time.
This chapter aims to cover three aspects of the epidemiology of childhood obesity: definition and assessment, changes in prevalence over time, and the prediction of future obesity. The results imply two parallel approaches to body-mass index (BMI) assessment: epidemiological classification based on the International Obesity Task Force (IOTF) BMI cutoffs (Cole et al., 2000) and longitudinal assessment based on BMI centile crossing.
DEFINITION AND ASSESSMENT
When a condition such as obesity is increasing at the rate seen over the past few decades, it is obviously important to keep track of the “epidemic” by monitoring its prevalence over time in a range of different situations. There are other good reasons to monitor prevalence. First, by relating differences in obesity prevalence from one community to another with differences in the prevalence of lifestyle risk factors, one can tease out certain aspects of lifestyle that predispose to, or alternatively protect against, obesity. Second, by using prevalence data to test the impact of intervention programs, one can perhaps identify an effective program that leads to a reduction in prevalence.
The first requirement for prevalence studies is a clear and unambiguous definition of the condition. Obesity is at its simplest excess adiposity, thus a definition requires a way to measure adiposity and a cutoff to identify at what point adiposity becomes excessive.
Surprisingly this is almost impossible to achieve. For a start, adiposity is difficult to measure—current expensive laboratory-based methods like dual-energy x-ray absorptiometry and isotope dilution do not measure body fat in exactly the same way and thus give slightly different answers; in addition, they are impractical for large-scale population use. Bioelectrical impedance has its advocates, but offers little more information than anthropometry. Weight and height are the simplest and most widely available anthropometry, usually summarized as BMI (BMI = weight/height2). However, this inexpensive and cheerful proxy for adiposity cannot distinguish between fat mass and lean mass, thus limiting its epidemiological value.
For large-scale studies in adults, the consensus is to measure adiposity using BMI, and the Garrow–Webster cutoffs of 25 and 30 kg/m2 are widely agreed as lower limits for overweight and obesity, respectively (Garrow and Webster, 1985). Ideally, cutoffs that provide a sensitive and specific diagnostic test for the risk of later morbidity or mortality should be chosen. However, this is generally not possible as the risk rises essentially linearly with BMI. Therefore, shifting the cutoff slightly up increases the sensitivity of the test at the expense of the specificity, and the sum of sensitivity and specificity is broadly independent of the exact cutoff chosen. Garrow-Webster cutoffs were therefore chosen empirically to be convenient round numbers as much as objective proxies for disease risk.
For children, excess adiposity is superimposed on normal growth-related adiposity changes, adding another layer of complexity. The definition of obesity first needs to establish what is normal adiposity for age, and then the cut-off can be set relative to normal to identify obesity with high sensitivity and specificity. Ideally, the gold standard should again be longterm outcome, allowing children at risk of a later adverse event to be identified in advance. This risk depends critically on the age of the child; therefore, knowledge of the relationship between adiposity and later outcome at different ages in childhood is necessary. In addition, the individual pattern of change in adiposity over time is important—a child who is fat early in life may have a risk in adult life different from a child who is thin in childhood but who becomes fat as a young adult. The current knowledge base linking child obesity to later outcome is completely inadequate to provide cutoffs based on this level of evidence.
The absence of an objective basis for setting the cutoffs coupled with the need to conveniently adjust adiposity for age in childhood resulted in an alternative approach of using age-adjusted BMI centiles. Conventionally, a growth centile chart is used to define abnormal growth, with an extreme centile on the chart acting as the cutoff to identify abnormality, By extension of this principle, BMI centiles such as the 85th, 91st, 95th. and 98th, which are based on U.S. or U.K. references, have been proposed to define overweight and/or obesity. However, the justification for any particular growth reference or centile is entirely ad hoc.
Altogether, the result has been entirely predictable—researchers have come up with their own personal definitions of child obesity, which are incompatible with other definitions. They choose a measure of weight-for-height, usually but not always BMI, a familiar growth reference, e.g., their own national reference, and a centile cutoff that seems suitable. Table 1.1 gives some examples of child obesity definitions from papers published over the past 7 years, and it is clear that they differ widely from each other. The problem with such definitions is that they all provide a percent prevalence, yet there is no way for novice users to realize that they cannot be compared with others.
Weight-Height Index | Criterion | Obesity Definition | Reference |
|---|---|---|---|
Body weight (Weight-9)/height3.7 | % ideal weight Value | > 120% Mean | Chu, 2001 Hughes et al., 1997 |
Weight for height | WHO z-score | > +2 z-scores | De Onis and Blossner, 2000 |
Weight for height | Thai centile | > 97th centile | Sakamoto et al., 2001 |
Body-mass index | U.S. CDC centile | > 95th centile | Troiano and Flegal, 1998 |
Body-mass index | U.K. z-score | Mean | Bundred et al., 2001 |
This highlights the need for an international definition of child obesity, authoritative enough for researchers to use worldwide, so as to provide prevalence rates that are directly comparable.
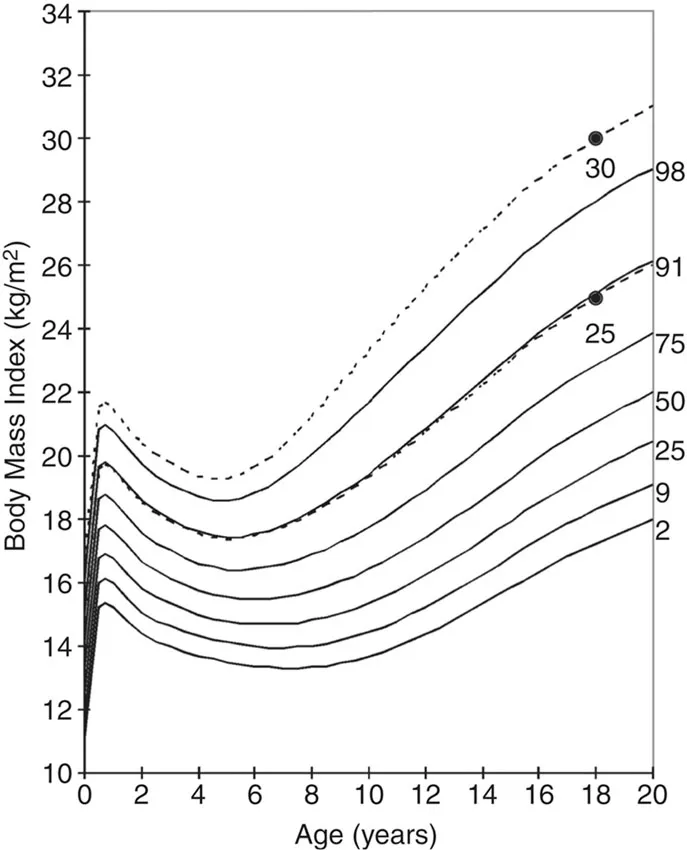
The IOTF recognized this problem of definition and called a workshop in 1997 to address it. Both the proceedings of the workshop (Bellizzi and Dietz, 1999) and more recently the IOTF international BMI cutoffs that were its main outcome (Cole et al., 2000) have been published. The IOTF cutoffs are based on the same principles as all the definitions in Table 1.1. IOTF uses BMI as the measure of adiposity but adjusts for age using centiles from an amalgam of six large national reference datasets (U.K., U.S., Singapore, Netherlands, Hong Kong, and Brazil) and uses “centile-like” cutoffs for overweight and obesity that are linked to the adult BMI cutoffs of 25 and 30 kg/m2 at age 18 years. The final part is the main innovation; the cutoffs use BMI centiles that are chosen to pass through the adult cutoffs at age 18. This means that the centile is broadly unaffected by whether the reference children are fat or thin — the cut-off is 25 (or 30) at age 18 whatever their level of fatness.
Figure 1.1 illustrates the principle for the British reference data. The usual seven or nine centiles on the BMI chart are augmented with another two centiles passing through 25 and 30 kg/m2 at age 18 years. This same process was followed for the other five datasets, leading to sets of six centile curves (one for each dataset) for overweight and obesity by sex. These four centile sets were then averaged by age to give pooled centile curves for overweight and obesity in boys and girls. The original reference (Cole et al., 2000) provides tables and plots of the separate centile curves and the averaged IOTF cutoffs.
CHANGES IN PREVALENCE OVER TIME
Since its publication in May 2000, the IOTF cutoffs’ article has been cited over 300 times, reflecting both the interest in childhood obesity and the potential value of an international definition. To give a flavor of the scale of published work based on the cutoffs, studies are summarized here that have compared prevalence rates of overweight in the same population at two or three time points, allowing rates of increase in childhood obesity to be compared across countries.
Figure 1.2 gives details for overweight in boys from 10 countries (Chinn and Rona, 2001; Kalies et al., 2002; Kautiainen et al., 2002; Magarey et al., 2001; Tremblay et al., 2002; Wang et al., 2002). Corresponding data for obesity and for girls, omitted here for reasons of space, are available in the original articles. They tell broadly the same story. The highest prevalences and steepest rises are seen in the U.S. and Canada, whereas in China the prevalence is low and rising slowly and in Russia it is actually falling. This is assumed due to Russia’s economic difficulties after the breakup of the USSR in the early 1990s. The other countries are all rising at broadly the same rate, about 4% per 10 years. Although the most recent data in the figure are from 2000, indications elsewhere show that the rate has been increasing more rapidly since then. Either way, the figure indicates the wide variation in o...
Table of contents
- Cover
- Half Title
- Title Page
- Copyright Page
- Table of Contents
- List of Illustrations
- List of Tables
- Contributors
- Introduction
- Part I: ASSESSING THE SCOPE AND IMPACT OF CHILDHOOD OBESITY
- PART II: THE ROLE OF BIOLOGICAL AND SOCIAL PROCESSES IN THE AETIOLOGY OF CHILDHOOD OBESITY
- PART III: THE PREVENTION AND TREATMENT OF CHILDHOOD OBESITY
- Index
Frequently asked questions
Yes, you can cancel anytime from the Subscription tab in your account settings on the Perlego website. Your subscription will stay active until the end of your current billing period. Learn how to cancel your subscription
No, books cannot be downloaded as external files, such as PDFs, for use outside of Perlego. However, you can download books within the Perlego app for offline reading on mobile or tablet. Learn how to download books offline
Perlego offers two plans: Essential and Complete
- Essential is ideal for learners and professionals who enjoy exploring a wide range of subjects. Access the Essential Library with 800,000+ trusted titles and best-sellers across business, personal growth, and the humanities. Includes unlimited reading time and Standard Read Aloud voice.
- Complete: Perfect for advanced learners and researchers needing full, unrestricted access. Unlock 1.5M+ books across hundreds of subjects, including academic and specialized titles. The Complete Plan also includes advanced features like Premium Read Aloud and Research Assistant.
We are an online textbook subscription service, where you can get access to an entire online library for less than the price of a single book per month. With over 1.5 million books across 990+ topics, we’ve got you covered! Learn about our mission
Look out for the read-aloud symbol on your next book to see if you can listen to it. The read-aloud tool reads text aloud for you, highlighting the text as it is being read. You can pause it, speed it up and slow it down. Learn more about Read Aloud
Yes! You can use the Perlego app on both iOS and Android devices to read anytime, anywhere — even offline. Perfect for commutes or when you’re on the go.
Please note we cannot support devices running on iOS 13 and Android 7 or earlier. Learn more about using the app
Please note we cannot support devices running on iOS 13 and Android 7 or earlier. Learn more about using the app
Yes, you can access Childhood Obesity by Noel Cameron,Gerard Hastings,George Ellison in PDF and/or ePUB format, as well as other popular books in Medicine & Nutrition, Dietics & Bariatrics. We have over 1.5 million books available in our catalogue for you to explore.