MRI monitors translational motion on millisecond time scales and micrometer length scales, which are several orders of magnitude larger than the molecular scales. Still, it is instructive to first assume a molecular perspective on diffusion in order to build an understanding of the relevant factors for explaining experimental observations on the much larger scales defined by MRI. From the perspective of water diffusion, biological tissue can be seen as an “obstacle course” formed by tightly packed assemblies of cells filled with and surrounded by macromolecules such as proteins, nucleic acids, and carbohydrates, and with outer boundaries defined by biomembranes comprising lipids, proteins, and cytoskeleton.
1.2.1 Biomembranes
The influence of biomembranes on water motion can be gleaned from the molecular dynamics simulation23 in Figure 1.1 focusing on the lipid components which spontaneously assemble into bilayers with minimal contact between the hydrophobic tails and the water. The simulation was carried out by defining initial atom positions consistent with experimental data for average bilayer thickness and lipid–lipid in-plane distance, drawing atom velocities from a distribution corresponding to a temperature of 298 K, and letting the system evolve deterministically according to Newton's laws of motion with a time-step of 2 fs and a total evolution time approaching 1 μs.24,25 The output of the simulation is a time-resolved series of atom coordinates, velocities, and forces, from which a wide range of structural, dynamic, and thermodynamic properties can be derived for validation against experimental data.
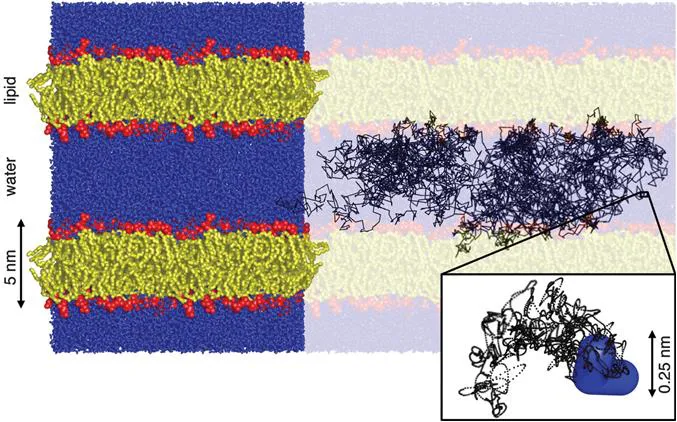
Figure 1.1 Molecular dynamics simulation of a united-atom model of the lipid 1-palmitoyl-2-oleoyl-sn-glycero-3-phosphocholine (POPC) at the temperature 298 K, pressure 1 bar, and hydration level 57 water molecules per lipid. The results are shown as a rendering of the final configuration overlain with a 50 ns trajectory of a single water hydrogen sampled at 10 ps intervals (black lines). The lipids are assembled into ∼5 nm thick bilayers with the hydrophilic headgroups (red) separating the hydrophobic tails (yellow) from the water (blue). The brightly colored region (left) comprises four replicas of the rectangular simulation box with 128 lipid molecules. The zoom-in (bottom right) shows a 10 ps segment of the hydrogen trajectory at the full 2 fs time resolution of the simulation (black dots) and the final location of the water molecule (blue). (GROMACS23 simulation results redrawn from ref. 25 using the POV-Ray freeware60).
Figure 1.1 shows the final configuration of the simulation overlain with a 50 ns trajectory of a single hydrogen atom on a water molecule. During this time, the water molecule has repeatedly traversed the 5 nm gap between the bilayers and made occasional brief excursions into the interiors of the bilayers, consistent with the low but non-zero solubility of water in hydrocarbons.26 Looking closer at the interface between the water and lipid layers reveals that the water density is decreasing smoothly from the bulk value to nearly zero over a ∼1 nm distance, corresponding to 3–4 molecular diameters of water. Although not immediately apparent by visual inspection of the figure, quantitative analysis of the simulation data shows a low but finite orientational ordering of the interfacial water,27 which is readily verified by, e.g., 2H NMR spectroscopy.28
The 50 ns trajectory sampled at time-steps of 10 ps may appear as a diffusive random walk with abrupt changes of direction for each step, but it is actually the result of the deterministic motion of a large number of atoms connected into molecules. The zoom-in on a 10 ps segment of the trajectory sampled at each 2 fs time-step of the simulation shows the ballistic regime29 with a smooth path resulting from the interplay between the velocities and inertias of the individual atoms of the water molecule and the forces from the surrounding atoms on neighboring molecules. The ps-scale reorientational dynamics of water in contact with biomolecules30,31 and inside bacterial cells32 and spores33 has been studied with 2H and 17O NMR relaxation dispersion. For living cells, 85% of the water reorients as rapidly as bulk water (∼2 ps correlation time). The remaining 15% that is in direct molecular contact with biomolecules is on average slowed down by a factor of ∼15, which however still yields reorientation on the time scale of a few tens of picoseconds.32 Correspondingly, quantitative analysis of the simulation trajectories shows that the water molecules during their ∼100 ps brief excursions into the bilayer interfacial region temporarily experience a factor ∼10 reduction in lateral diffusivity compared to bulk water on account of being surrounded by lipids with lateral diffusivity ∼100 times slower than water.27
The moderate effects of the lipids on the neighboring water in Figure 1.1 stand in stark contrast to illustrations that occasionally appear in the MRI literature,34,35 where biomembranes are depicted as covered by perfectly layered and aligned water molecules in support of the “biphasic model” of water diffusion in biological tissues.36–38 As elaborated on by Jungwirth,39 the notion of highly ordered cell water with properties radically different from conventional liquid water has a long history at the fringes of science and is related to the nowadays discredited theories of water polymerization and “memory” of previous contacts with solutes.
Although the lipid membranes have negligible influence on the molecular-scale water dynamics beyond direct molecular contact, the low water concentration in the bilayer interior means that the membranes are efficient barriers for long-range water diffusion. The low permeability is manifested as low water diffusivities as measured with conventional diffusion NMR across macroscopically ordered stacks of hydrated lipid membranes40 or in foam-like emulsions where the membranes divide the water into discrete compartments with <1 μm radius.41