Data, Matter, Design presents a comprehensive overview of current design processes that rely on the input of data and use of computational design strategies, and their relationship to an array of outputs.
Technological changes, through the use of computational tools and processes, have radically altered and influenced our relationship to cities and the methods by which we design architecture, urban, and landscape systems. This book presents a wide range of curated projects and contributed texts by leading architects, urbanists, and designers that transform data as an abstraction, into spatial, experiential, and performative configurations within urban ecologies, emerging materials, robotic agents, adaptive fields, and virtual constructs.
Richly illustrated with over 200 images, Data, Matter, Design is an essential read for students, academics, and professionals to evaluate and discuss how data in design methodologies and theoretical discourses have evolved in the last two decades and why processes of data collection, measurement, quantification, simulation, algorithmic control, and their integration into methods of reading and producing spatial conditions, are becoming vital in academic and industry practices.
Trusted by 375,005 students
Access to over 1.5 million titles for a fair monthly price.
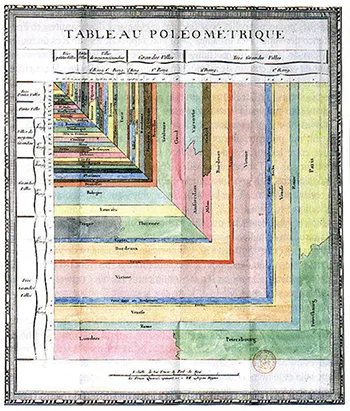
Design as discipline is often driven by processes that involve intuition, iteration, testing, refinement, and the production of scenarios. Within this framework, data has the potential for providing a platform that can drive decision making as well as reveal the unseen and intangible within the design process. With the exponential growth of the use of data within all disciplines of design, we are witnessing a higher level of integration, hybridization, and cross-fertilization of the application of data among spatial practitioners including architects, urbanists, designers, and artists. This phenomenon triggers a spontaneous question: Why do designers use or need data as part of their design process? The use of data in design is not a novel form of application, throughout history architects have used data in design processes. Data is “something that has been shaping architecture, planning, and design for generations knowingly or not. It is being collected in so many ways it’s scary to fathom” (Deutsch, 2015). Designers have inherently used data within the design process even without being aware of it. For instance, we can find early examples of data visualized through maps that organized information into visual formats. Charles Joseph Minard, a French civil engineer, in 1812 depicted the map of Napoleon’s Russian campaign through numerical data and geographic information (Figure 1.1). Edmond Halley, an astronomer, geophysicist, meteorologist, mathematician, and physicist, computed and mapped magnetic declination at sea for ship navigation purposes, now known as isogonic lines, in his Atlantic Chart, c. 1700. (Figure 1.2). Charles de Fourcroy, a French mathematician and scholar, in 1782, published Tableau Poléometrique, a display of hierarchical data to classify towns by their surface area through geometric shapes as an early example of treemap (Figure 1.3).
Figure 1.1 Charles Joseph Minard, Map of Napoleon’s Russian campaign, 1812.
Public domain
Figure 1.2 Edmond Halley, Atlantic Chart, c. 1700.
Public domain
Figure 1.3 Charles de Fourcroy, Tableau Poléometrique, 1782.
Public domain
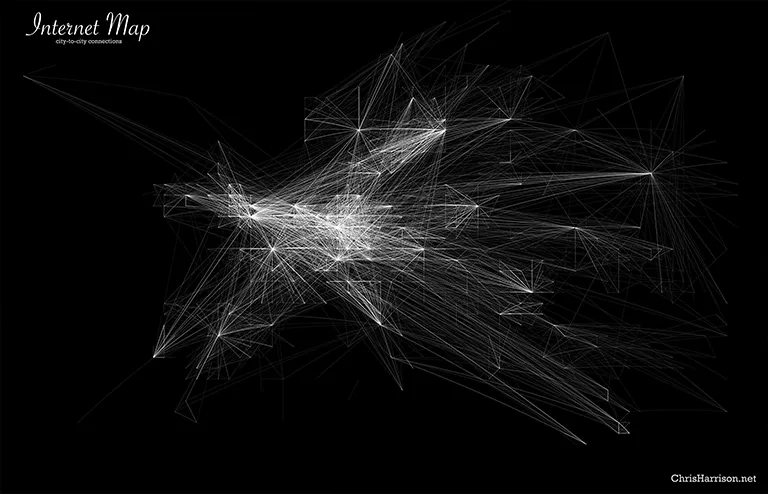
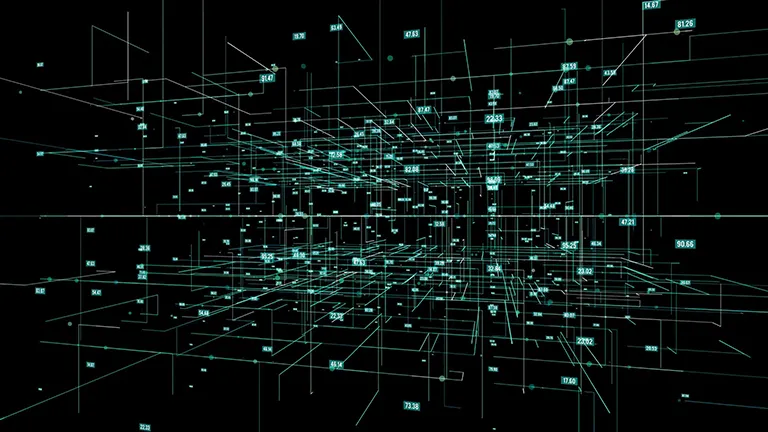
The proliferation of the use of data in design emerges from the evolution and advancement of technology that allows for data to be collected, quantified, and analyzed in manifold forms. In parallel to that, the notion of “data” is being increasingly encountered in spatial, creative, and cultural studies; processes, methods, and vocabularies from the sciences are borrowed, discussed, tweaked, and new cross-disciplinary fields emerge (Karandinou, 2019). Data in themselves, without application or a critical eye, are quite useless. The question is always the type of lens that we are using to collect, filter, analyze, and ultimately apply data. For designers, the questions and opportunities that arise from the lens used to apply data in design processes are both generative and productive forms of inquiry. Big Data as a term is still evolving. It commonly describes a large volume of information that can take different analytical and visual forms and can be used in multiple ways. Big Data is associated with data mining as the practice of analyzing a large volume of data or databases/data sets in order to create new relationships and gain new insights or information. The act of data mining produces “usable” data from a set of raw data through the analyzation of patterns, relationships, and correlations. Data are transformed from an abstract set to usable information to predict, evaluate, and correlate scenarios. Through data mining processes and techniques, structures and patterns emerge. Data scientists use “mining” approaches in all categories and levels of data through computational operations such as multidimensional databases, machine learning, visualization, soft computing, and genetic algorithms. There are 2.5 quintillion bytes of data created each day at our current pace, but that pace is only accelerating with the growth of the Internet of Things (IoT) (Marr, 2018). These types of data come from the current high level of connectivity (Figure 1.4) and the expanded services and products generated by the IoT such as social media, communication, the internet itself, digital photos, and services.
Figure 1.4 Chris Harrison, Internet Maps: European City-to-City Connections.
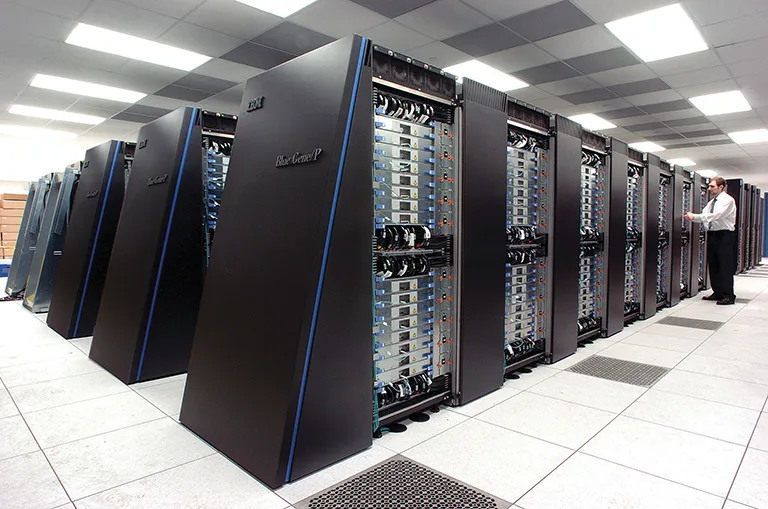
The rapid evolving application of computational processes in design requires a large informational infrastructure to manage complex data sets needed to compute operations. Cloud computing (Figure 1.5) is the general term used to identify a network of remote servers that belong to the cloud or the internet to store, retrieve, manage, and process data rather than a local server on a personal computer. Cloud computing is impacting our everyday lives even if we are not aware of it. It is structured as a network of different scales and it is based on the remote sharing of resources, information, and economies. At the foundation of cloud computing is the broader concept of converged infrastructures and shared services.
Figure 1.5 The IBM Blue Gene/P Supercomputer Installation at the Argonne Leadership Angela Yang Computing Facility Located in the Argonne National Laboratory, in Lemont, Illinois, USA.
Public domain
Cloud resources are usually not only shared by multiple users but are also dynamically reallocated per demand. With cloud computing, multiple users can access a single server to retrieve and update their data without purchasing licenses for different applications (Omankwu et al., 2016). How does this change the speed of sharing data in design processes?
The collection, transmission, and processing of data have been laborious and expensive since the beginning of civilization. Today for the first time we have more data than we need (Carpo, 2017). Mario Carpo in The Second Digital Turn: Design Beyond Intelligence argues that we are shifting towards a new way of thinking from a new way of making. The change in the way of thinking is primarily influenced by the rise of high computational infrastructures and how data are used, partially influenced by the increased uses of Building Information Modeling (BIM) in design. The era of cloud computing, algorithms, machine learning, and artificial intelligence has replaced or recontextualized the 1990’s novel forms of making associated with computer-based modeling and manufacturing. The convergence of design and thinking associated with the high speed of technology makes the gap smaller between the design process, the testing phase, and resulting constructability. Simulations, real-time modeling, evaluations, and analysis become all part of the same process; thinking is completely embedded with the capacity to compute data in real time and at high speed. The governance of the algorithm in design celebrates data as its primary matter (Figure 1.6). Algorithms are sequenced sets of rules, data are their inputs.
Figure 1.6 Big Data Visualization, Machine Learning Algorithms, and Information Analysis.
Public domain
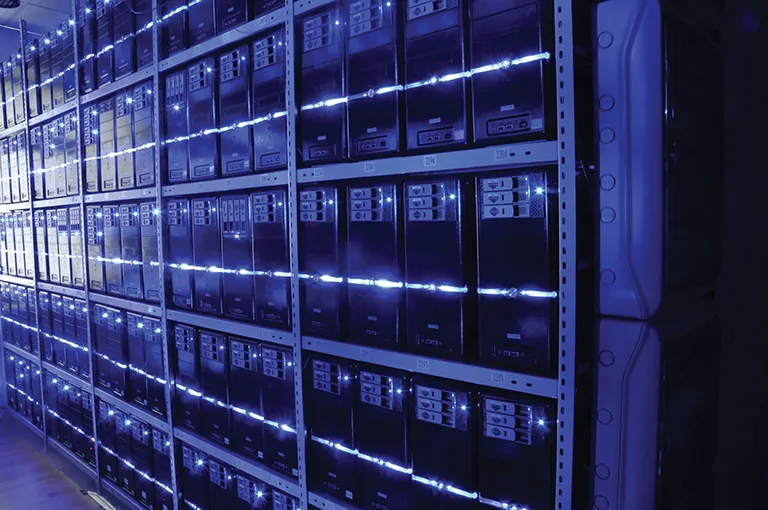
On one hand, more complex systems and computational capabilities are facilitating processes of networking and sharing; on the other, they are creating a surplus of data that in reality we don’t know how to manage or deal with. In design practices, this excess of data usage and shared information is changing our methods of design and how things are approached within the design process. We know that this shift started many years ago but it is now picking up at such rapid speed that both opportunities and consequences have still yet to be evaluated. Data are abstract in themsel ves, are not tangible in their forms but, on the contrary, they become informed in processes of evaluation, analysis, and decision making, both in design and other disciplines. The abstractness of the cloud is balanced by the physical and tangible effects produced. For instance, if we think about the high impact of data centers (Figure 1.7) on the physical morphologies of cities, we become immediately aware that the remote cloud is actually highly physical in its manifestation.
Figure 1.7 Server room of Baltic Servers.
Public domain
In terms of identifying types of data, we can categorize them into two types: Quantitative data – data that tells you “what” is happening (or not happening), usually, it’s a numerical data; and Qualitative data – data that tells you “why” this is happening. Qualitative insights aren’t numeric (Adobe, 2018). Within design practices and processes, each type has a specific value and meaning in its application. In respect to quantitative vs qualitative data, we can begin to speculate on how they might inform different types of projects in design practices; some projects might need to be more focused on quantitative data, for instance, evaluation and analysis in building simulations; some others on qualitative data, for instance, a responsive environment able to trigger human experience; in some other cases a mix of the two is needed. Are architects really equipped to deal with these increasingly complex systems and applications? We are witnessing both the capacity and the need for working collaboratively; for instance, from research-based projects developed in academia to multi-scalar projects developed in design firms, data scientists, data analysts, and data visualization experts are increasingly working with architects, engineers, and urban planners to envision projects from a holistic perspective.
According to the type of data, as designers, what are the methods at our disposal to collect data? The coexistence of analog and digital method of acquiring data has existed for a long time; the need to collect...
Table of contents
Cover
Half Title
Title Page
Copyright Page
Table of Contents
Acknowledgments
Contributor Bios
INTRODUCTION
PART 1: DATA, MATTER, DESIGN
PART 2: STRATEGIES FOR DATA-DRIVEN PROJECTS
Index
Frequently asked questions
Yes, you can cancel anytime from the Subscription tab in your account settings on the Perlego website. Your subscription will stay active until the end of your current billing period. Learn how to cancel your subscription
No, books cannot be downloaded as external files, such as PDFs, for use outside of Perlego. However, you can download books within the Perlego app for offline reading on mobile or tablet. Learn how to download books offline
Perlego offers two plans: Essential and Complete
Essential is ideal for learners and professionals who enjoy exploring a wide range of subjects. Access the Essential Library with 800,000+ trusted titles and best-sellers across business, personal growth, and the humanities. Includes unlimited reading time and Standard Read Aloud voice.
Complete: Perfect for advanced learners and researchers needing full, unrestricted access. Unlock 1.5M+ books across hundreds of subjects, including academic and specialized titles. The Complete Plan also includes advanced features like Premium Read Aloud and Research Assistant.
Both plans are available with monthly, semester, or annual billing cycles.
We are an online textbook subscription service, where you can get access to an entire online library for less than the price of a single book per month. With over 1.5 million books across 990+ topics, we’ve got you covered! Learn about our mission
Look out for the read-aloud symbol on your next book to see if you can listen to it. The read-aloud tool reads text aloud for you, highlighting the text as it is being read. You can pause it, speed it up and slow it down. Learn more about Read Aloud
Yes! You can use the Perlego app on both iOS and Android devices to read anytime, anywhere — even offline. Perfect for commutes or when you’re on the go. Please note we cannot support devices running on iOS 13 and Android 7 or earlier. Learn more about using the app
Yes, you can access Data, Matter, Design by Frank Melendez, Nancy Diniz, Marcella Del Signore, Frank Melendez,Nancy Diniz,Marcella Del Signore in PDF and/or ePUB format, as well as other popular books in Architecture & Architecture General. We have over 1.5 million books available in our catalogue for you to explore.