- 276 pages
- English
- ePUB (mobile friendly)
- Available on iOS & Android
eBook - ePub
About this book
Doing data science is difficult. Projects are typically very dynamic with requirements that change as data understanding grows. The data itself arrives piecemeal, is added to, replaced, contains undiscovered flaws and comes from a variety of sources. Teams also have mixed skill sets and tooling is often limited. Despite these disruptions, a data science team must get off the ground fast and begin demonstrating value with traceable, tested work products. This is when you need Guerrilla Analytics.
In this book, you will learn about:
The Guerrilla Analytics Principles: simple rules of thumb for maintaining data provenance across the entire analytics life cycle from data extraction, through analysis to reporting.
Reproducible, traceable analytics: how to design and implement work products that are reproducible, testable and stand up to external scrutiny.
Practice tips and war stories: 90 practice tips and 16 war stories based on real-world project challenges encountered in consulting, pre-sales and research.
Preparing for battle: how to set up your team's analytics environment in terms of tooling, skill sets, workflows and conventions.
Data gymnastics: over a dozen analytics patterns that your team will encounter again and again in projects
- The Guerrilla Analytics Principles: simple rules of thumb for maintaining data provenance across the entire analytics life cycle from data extraction, through analysis to reporting
- Reproducible, traceable analytics: how to design and implement work products that are reproducible, testable and stand up to external scrutiny
- Practice tips and war stories: 90 practice tips and 16 war stories based on real-world project challenges encountered in consulting, pre-sales and research
- Preparing for battle: how to set up your team's analytics environment in terms of tooling, skill sets, workflows and conventions
- Data gymnastics: over a dozen analytics patterns that your team will encounter again and again in projects
Trusted by 375,005 students
Access to over 1.5 million titles for a fair monthly price.
Study more efficiently using our study tools.
Information
Part 1
Principles
Introducing Guerrilla Analytics
Guerrilla Analytics: Challenges and Risks
Guerrilla Analytics Principles
Chapter 1
Introducing Guerrilla Analytics
Summary
In this chapter, we begin by discussing the very broad field of data analytics and what it means to do data analytics. To help us frame the subject of this book and escape any marketing and hype terminology, we will define what “data analytics” means for us. We will then look at the various types of projects in which data analytics is performed. This will give us an understanding of the entire spectrum of data analytics projects. We describe the particular type of analytics project that are the subject of this book. Specifically, these projects are defined by being very dynamic and having many disruptions while also being subject to several constraints. These are “Guerrilla Analytics” projects.
Keywords
Guerrilla Analytics
Introduction
Terminology
Having read this chapter, you will understand
• what data analytics is in a very general sense
• the projects in which data analytics is applied
• the type of analytics that is “Guerrilla Analytics”
• examples of Guerrilla Analytics projects
1.1. What is data analytics?
The last decade has seen phenomenal growth in the creation of data and in the analysis of data to provide insight. Social media and search giants such as Facebook and Google probably spring to mind. These analytics innovators gather immense amounts of data to understand Internet search and social habits so that they can better target online advertising for their customers. Online digital media is generating hours of content and streaming it around the globe for major sporting events such as the FIFA World Cup and the Olympics. In the Financial Services industry, firms process and store billions of financial transactions every day and analyze those transactions to gain an edge in the market over their competitors. Ubiquitous Telco operators store data on our call patterns to analyze it for indicators of customer churn and up-selling opportunities. Every time you book a hotel, flight, or go to the supermarket, loyalty card data is analyzed to better understand customer-purchasing habits and to better target marketing opportunities.
And this growth in data and analytics is not restricted to businesses. Scientific research centers are also creating immense amounts of experimental data in fields such as particle physics, genetics, and pharmacology. Government departments too are not exempt from this trend.
The complexity and pace of change have created a market for data analytics teams in consulting services firms to help their clients both cope with and profit from new data-driven opportunities.
Unsurprisingly, given the growth in data generation, the last decade has also seen a proliferation of the skills and tools needed for extracting value from data. Names for this field include Data Analytics, Data Mining, Quantitative Analysis, Big Data, Machine Learning, Business Intelligence, Artificial Intelligence, and Data Science. Vendors are frantically racing to provide enterprise grade tools to support work in these fields and to distinguish their offerings from those of their competitors. Universities are trumpeting degree programs that will train a generation of graduates to be conversant in these new technologies and skills.
All of this marketing noise, vendor hype, and pace of change can be confusing and overwhelming for somebody who just wants to get started in data and answer questions to solve problems. Big Data, data velocity, unstructured data, NoSQL, key-value stores, predictive modeling, social network analysis – it is very hard to know where to begin.
Before we get into the details, it will be helpful to step back and think a little about what “data analytics” can mean and agree on what it means to us in this book. Wikipedia, for example, defines “data analytics” as:
... a process of inspecting, cleaning, transforming, and modelling data with the goal of discovering useful information, suggesting conclusions, and supporting decision making. Data analysis has multiple facets and approaches, encompassing diverse techniques under a variety of names, in different business, science, and social science domains. (Anon n.d.)
This definition acknowledges the wide range of activities encompassed by the term data analytics. Tom Davenport’s book “Competing on Analytics” offers the following definition.
By analytics we mean the extensive use of data, statistical and quantitative analysis, explanatory and predictive models, and fact-based management to drive decisions and actions. The analytics may be input for human decisions or may drive fully automated decisions. (Davenport, 2006)
Again this is a broad definition. Clearly there are many different opinions on what data analytics is and what it should be called. Let’s step back and define data analytics for the purposes of this book.
1.1.1. Data Analytics Definition
First and foremost, this book is a practitioner’s book. We, therefore, need a practical definition of data analytics, so we can agree on what is in scope for discussion and what should be left to academic debate.
Data analytics is any activity that involves applying an analytical process to data to derive insight from the data.
Figure 1 illustrates this definition. A customer and/or a third party provides raw data to an analytics team. Analysis is done on the data, producing some modified data output. This output is returned to the customer to provide the customer with insight.
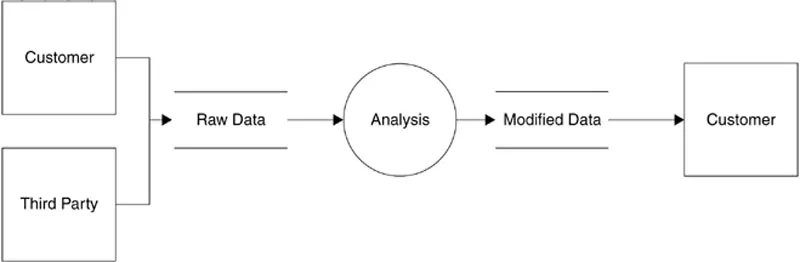
Figure 1 Definition of data analytics
1.1.2. Examples of Data Analytics
Such a general definition of data analytics means we can recognize analytics in many scenarios. Here are just a small number of data analytics activities.
• A phone company’s customer complaints team keys in 500 poorly scanned customer complaint letters for their data team. The data team reports back on what the common complaint theme is in those letters. They have converted data that was difficult to access into usable data, which was then enriched with complaint keywords. They now have an insight into the common complaint themes from their customers.
• My dad gives me a spreadsheet of household purchases and I tell him how much he spends on groceries per month. I have taken data in the form of dates and purchases and summarized them by month to provide insight into spending patterns.
• Emma, the IT administrator, is concerned about user access controls. She gives Aaron, the data analyst, a year of system log activity. Aaron reports back how users can be grouped based on their activity and what the likely activity is at a particular time on a particular day of the week. Emma now has an insight into who is doing what on the systems she manages.
• Feargus is always looking for new indie bands. An online streaming music website trawls through its user data, mining song plays to make recommendations to Feargus on new artists that he might like.
• A utilities contractor receives its subcontractors’ expense claims in hundreds of spreadsheets every month. These spreadsheets are brought together in a database, cleaned, and used to report on subcontractor expenses and search for potentially fraudulent expense claims.
• A financial services firm called OlcBank, having mis-sold financial products to their customers, is tasked with reconstructing the history of its product sales for inspection by a third party and a government regulator.
• A manufacturing plant Widget Inc., suspicious of fraud in its material purchase approvals wants to search its financial and manufacturing data for evidence of fraud.
There are several points to note from these examples of data analytics activities.
• Technology agnostic: First, there is no mention of any specific technology involved in the data analytics process. The analyst may be dragging formulas in a spreadsheet. They may be pushing data through the latest parallel streaming data processor. They may be training a troop of analytical monkeys to manipulate the data as required. Our definition is independent of the technology used and should not be confounded with the latest technology trend.
• Activity agnostic: Second, there is no differentiation between different types of data analytics activities. Some work is descriptive analytics that creates a summary and profile of data. Other work is data mining that trawls through data looking for patterns. Some work is predictive analytics that builds a model of the data and uses it to make predictions about new data. Some work is combinations of these things. The details of what is done with the data do not matter as long as the data is used to produce insight at some level of sophistication.
• Scale agnostic: Third, there is no attempt to comment on the scale or type of the data being analyzed. The work can deal with 100 rows in a spreadsheet table, 10,000 text documents describing insurance claims or some social media data feed approaching scales currently called “Big Data” (Franks, 2012).
This book is aimed at people involved in taking a variety of types of data from a variety of sources, analyzing it with a variety of methods of varying sophistication and returning it to their customers with insight. This insight can be used to make recommendations and take actions.
I cannot emphasize enough the importance of our general data analytics definition. It may surprise you how many activities can be considered as data analytics and how often people fail to recognize that they are working with data and doing analytics!
1.2. Types of data analytics projects
Data analytics projects exist on a spectrum. At one end of this spectrum we have projects that are close to traditional software engineering projects. By traditional software engineering I mean the production of websites and web applications, desktop software applications, and data warehouses. To develop these analytics applications, a data model is carefully specified, coded, tested, and rolled out through development, user acceptance, and production environments. A presentation layer or application layer is programmed to sit on top of this data and present it to users so they can interact with it. User...
Table of contents
- Cover
- Title page
- Table of Contents
- Copyright Page
- Preface
- Part 1: Principles
- Part 2: Practice
- Part 3: Testing
- Part 4: Building Guerrilla Analytics Capability
- Appendix: Data Gymnastics
- References
- Index
Frequently asked questions
Yes, you can cancel anytime from the Subscription tab in your account settings on the Perlego website. Your subscription will stay active until the end of your current billing period. Learn how to cancel your subscription
No, books cannot be downloaded as external files, such as PDFs, for use outside of Perlego. However, you can download books within the Perlego app for offline reading on mobile or tablet. Learn how to download books offline
Perlego offers two plans: Essential and Complete
- Essential is ideal for learners and professionals who enjoy exploring a wide range of subjects. Access the Essential Library with 800,000+ trusted titles and best-sellers across business, personal growth, and the humanities. Includes unlimited reading time and Standard Read Aloud voice.
- Complete: Perfect for advanced learners and researchers needing full, unrestricted access. Unlock 1.5M+ books across hundreds of subjects, including academic and specialized titles. The Complete Plan also includes advanced features like Premium Read Aloud and Research Assistant.
We are an online textbook subscription service, where you can get access to an entire online library for less than the price of a single book per month. With over 1.5 million books across 990+ topics, we’ve got you covered! Learn about our mission
Look out for the read-aloud symbol on your next book to see if you can listen to it. The read-aloud tool reads text aloud for you, highlighting the text as it is being read. You can pause it, speed it up and slow it down. Learn more about Read Aloud
Yes! You can use the Perlego app on both iOS and Android devices to read anytime, anywhere — even offline. Perfect for commutes or when you’re on the go.
Please note we cannot support devices running on iOS 13 and Android 7 or earlier. Learn more about using the app
Please note we cannot support devices running on iOS 13 and Android 7 or earlier. Learn more about using the app
Yes, you can access Guerrilla Analytics by Enda Ridge in PDF and/or ePUB format, as well as other popular books in Business & Business Intelligence. We have over 1.5 million books available in our catalogue for you to explore.