- 234 pages
- English
- ePUB (mobile friendly)
- Available on iOS & Android
eBook - ePub
About this book
Implementing Analytics demystifies the concept, technology and application of analytics and breaks its implementation down to repeatable and manageable steps, making it possible for widespread adoption across all functions of an organization. Implementing Analytics simplifies and helps democratize a very specialized discipline to foster business efficiency and innovation without investing in multi-million dollar technology and manpower. A technology agnostic methodology that breaks down complex tasks like model design and tuning and emphasizes business decisions rather than the technology behind analytics.
- Simplifies the understanding of analytics from a technical and functional perspective and shows a wide array of problems that can be tackled using existing technology
- Provides a detailed step by step approach to identify opportunities, extract requirements, design variables and build and test models. It further explains the business decision strategies to use analytics models and provides an overview for governance and tuning
- Helps formalize analytics projects from staffing, technology and implementation perspectives
- Emphasizes machine learning and data mining over statistics and shows how the role of a Data Scientist can be broken down and still deliver the value by building a robust development process
Trusted by 375,005 students
Access to over 1.5 million titles for a fair monthly price.
Study more efficiently using our study tools.
Information
Part 1
Concept
Chapter 1 Defining Analytics
Chapter 2 Information Continuum
Chapter 3 Using Analytics
Chapter 1
Defining Analytics
Contents
The Hype
The Challenge of Definition
Definition 1: Business Value Perspective
Definition 2: Technical Implementation Perspective
Analytics Techniques
Algorithm versus Analytics Model
Forecasting
Descriptive Analytics
Clustering
Predictive Analytics
Prediction versus Forecasting
Prediction Methods
Decision Optimization
Conclusion of Definition
The Hype
Analytics is one of the hot topics on today’s technology landscape (also referred as Big Data), although it is somewhat overshadowed by the high-profile social media revolution and perhaps also by the mobile revolution led by Apple Inc., which now includes smartphones, applications, and tablets. Social media, mobile, and tablet revolutions have impacted an individual’s life like never before, but analytics is changing the lives of organizations like never before. The explosion of newer data types generated from all sorts of channels and devices makes a strong argument for organizations to make use of that data for valuable insights. With this demand and emergence of cost-effective computing infrastructure to handle massive amounts of data, the environment is ripe for analytics to take off. However, like any technology that becomes a buzz word, the definition becomes more and more confusing with various vendors, consultants, and trade publications taking a shot at defining the new technology (analytics is actually not new but it has been reborn with Big Data; see Chapter 11). It becomes extremely difficult for people intrigued by this topic to sort through the confusing terminology to understand what it is, how it works, and how they can make use of it. This happened with ERP and e-commerce in the mid- to late 1990s and with CRM in the early 2000s. Over time, as the industry matures, consensus emerges on what is the definition and who are the dominant players, respectable trade publications, established thought leaders, and leading vendors.
The data warehousing industry was the first to tackle data as an asset and it also went through a similar hype cycle where terms like OLAP (online analytical processing), decision support, data warehousing, and business intelligence were all used to define some overlapping concepts with blurring boundaries. The term that eventually took hold is business intelligence (BI) with the data warehouse becoming a critical central piece. BI included everything—activities like data integration, data quality and cleansing, job scheduling and data management, various types of reporting and analytical products, professionals, delivery and maintenance teams, and users involved with getting value out of a data warehouse. BI as an industry has matured and become well structured with accompanying processes, methodologies, training, and certifications, and is now an essential part of IT in all major public or private organizations.
While analytics is an extension of BI in principle and it is natural for existing BI vendors, implementers, and professionals to extend their offering beyond reporting into analytics, it should be separated from a traditional data warehousing and reporting definition. We have lived with that definition of BI for the last 10 years and there is no reason to confuse the landscape. It is important to differentiate between BI in which reporting and data warehousing are incorporated, and analytics in which data mining, statistics, and visualization are used to gain insights into future possibilities. BI answers the question “How did we do?” whereas analytics answers the question “What should we do?” BI answers the question “What has happened?” and analytics answers the question “What can happen?” The temptation to replace BI with analytics as an overarching term to refer to anything related to data is going to be counterproductive. The material presented in this book will provide a detailed step-by-step approach to building analytics solutions and it will use BI as a foundation. Therefore, it is important to keep the two concepts separate and the two terms complimentary.
The Challenge of Definition
To help demystify analytics and provide a simplified view of the subject while looking at its significance, wide use, and application, we will look at several definitions:
■ Merriam-Webster (2012): The method of logical analysis.
■ Oxford Dictionary (2012): The term was adopted in the late 16th century as a noun denoting the branch of logic dealing with analysis, with specific reference to Aristotle’s treatises on logic.
■ Eckerson’s book (2012), which covers the expertise of leading analytics leaders, defines it as everything involved in turning data into insights into action.
These are very broad definitions and don’t really help understand analytics in an implementation and technology context. Instead of defining analytics as a dictionary would do, let’s look at some characteristics of analytics that can help simplify the conceptual foundation to understand its various moving parts, allow filtering of the marketing hype, and look for pieces needed for specific solutions regardless of what they are being called.
We will use two different perspectives to lay out the characteristics of analytics: one is related to how business value is achieved and the other regards how it is implemented. But the definition of analytics here will be more of a definition of analytics solutions overall and not necessarily a few tools or techniques. The definition will be broad enough to help readers understand and apply it to their benefit, yet it will have specific boundaries to distinguish from other related technologies and concepts to ensure expectations are met from analytics investment.
Definition 1: Business Value Perspective
The business value perspective looks at data in motion as it is generated through normal conduct of business. For this data, there are three variations of value: the present, the past, and the future, in that exact order. When data is created, referenced, modified, and deleted during the course of normal business activities, it lives in an operational system. The operational system at any given time can tell us where we stand now and what we are doing now. The data at a specific point in time is of relevance to people in day-to-day operations selling merchandise, reviewing applications, counting inventories, assisting customers, etc. The data and the activities are focused on very short durations from a time perspective. This data from “Now” is the first variation of business value—that of present activities; over time, it becomes stale and is retained for recordkeeping and starts to build history.
This historical data, usually in a data warehouse, can then be reviewed to understand how a business did in the last month, quarter, or year. This information is relevant to business managers since they can see business performance metrics, such as total sales, monthly counts of new customers, total number of service calls attended, total defects reported, total interruptions in business, total losses, etc. This is typically done through reporting. The analysis from this historical review of information provides managers the tools to understand the performance of their departments. This is the second variation of business value—that of past activities. This leads into what the managers should be doing within their departments and business units to improve their performance. The historical data doesn’t tell them what to do; it just tells them how they did. Historical data is then run through some advanced statistics and mathematics to figure out what should be done and where the energies should be focused.
This leads to the third variation of the business value—that of future activities. Analytics (or Big Data) belong to this variation: What should we be doing? Any tools, technologies, or systems that help with that can qualify to be in the analytics space. This business value perspective of analytics is driven from the usage or outcome of the data rather than the implementation. Figure 1.1 explains this definition.
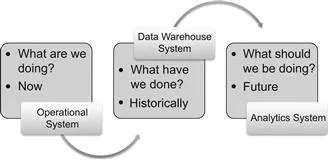
Figure 1.1 Analytics definition 1: business value perspective.
Therefore, the business perspective of the analytics definition deals with future action and any technology, product, or service that contributes towards the action can qualify to be part of analytics solutions. It can be argued that historical analysis also gives ideas on what should be done in the future, such as terminate an unprofitable product line or close down a store, but later chapters will show that the analytics solution is actually very specific about future actions based on historical trends and patterns and is not reliant on humans interpreting the historical results and trying to determine the actions rather subjectively.
Another way to define analytics will be from the technical perspective. This perspective has been influenced from the published works of Thornton May on this topic (May, 2009).
Definition 2: Technical Implementation Perspective
The technical implementation perspective describes the characteristics of analytics in terms of the techniques used to implement the analytics solution. If any of the following four data analysis methods are used, the solution is qualified as an analytics solution:
1. Forecasting techniques
2. Descriptive analytics (clustering, association rules, etc.)
3. Predictive analytics (classification, regression, and text mining)
4. Decision optimization techniques
These methods will be defined in more detail subsequently in this chapter, but they will be layman’s definitions and will only provide a broad understanding of these methods and their use. For a detailed understanding of these techniques, a lot of good literature is already available in the market like Data Mining Techniques: For Marketing, Sales, and Customer Relationship Management by Gordon Linoff and Michael Berry (2011), and Data Mining: Concepts and Techniques by Jiawei Han and Micheline Kamber (2011).
If the use of these techniques makes it an analytics solution, why not use this definition alone? Why do we even need the first business perspective definition? Data visualization is what throws off this technical definition. Data visualization deals with representing data in a visual form that is easy to understand and follow. Although it is representing the past, once the visual representation emerges, there are always clusters of data points visually obvious that immediately lead to future actions. For example, in case of geographic information systems (GISs; also clubbed in data visualization), the historical sales data is laid out on a map with each point representing a customer address. Immediately looking at the map with clusters of customers in certain areas, management can decide about advertising in that region, open...
Table of contents
- Cover image
- Title page
- Table of Contents
- Copyright
- Acknowledgments
- Author Biography
- Introduction
- Part 1: Concept
- Part 2: Design
- Part 3: Implementation
- Conclusion
- References
- Index
Frequently asked questions
Yes, you can cancel anytime from the Subscription tab in your account settings on the Perlego website. Your subscription will stay active until the end of your current billing period. Learn how to cancel your subscription
No, books cannot be downloaded as external files, such as PDFs, for use outside of Perlego. However, you can download books within the Perlego app for offline reading on mobile or tablet. Learn how to download books offline
Perlego offers two plans: Essential and Complete
- Essential is ideal for learners and professionals who enjoy exploring a wide range of subjects. Access the Essential Library with 800,000+ trusted titles and best-sellers across business, personal growth, and the humanities. Includes unlimited reading time and Standard Read Aloud voice.
- Complete: Perfect for advanced learners and researchers needing full, unrestricted access. Unlock 1.5M+ books across hundreds of subjects, including academic and specialized titles. The Complete Plan also includes advanced features like Premium Read Aloud and Research Assistant.
We are an online textbook subscription service, where you can get access to an entire online library for less than the price of a single book per month. With over 1.5 million books across 990+ topics, we’ve got you covered! Learn about our mission
Look out for the read-aloud symbol on your next book to see if you can listen to it. The read-aloud tool reads text aloud for you, highlighting the text as it is being read. You can pause it, speed it up and slow it down. Learn more about Read Aloud
Yes! You can use the Perlego app on both iOS and Android devices to read anytime, anywhere — even offline. Perfect for commutes or when you’re on the go.
Please note we cannot support devices running on iOS 13 and Android 7 or earlier. Learn more about using the app
Please note we cannot support devices running on iOS 13 and Android 7 or earlier. Learn more about using the app
Yes, you can access Implementing Analytics by Nauman Sheikh in PDF and/or ePUB format, as well as other popular books in Computer Science & Data Processing. We have over 1.5 million books available in our catalogue for you to explore.