- 160 pages
- English
- ePUB (mobile friendly)
- Available on iOS & Android
eBook - ePub
Mathematical Modelling
About this book
Mathematical modelling modules feature in most university undergraduate mathematics courses. As one of the fastest growing areas of the curriculum it represents the current trend in teaching the more complex areas of mathematics. This book introduces mathematical modelling to the new style of undergraduate - those with less prior knowledge, who require more emphasis on application of techniques in the following sections: What is mathematical modelling?; Seeing modelling at work through population growth; Seeing modelling at work through published papers; Modelling in mechanics.Written in the lively interactive style of the Modular Mathematics Series, this text will encourage the reader to take part in the modelling process.
Trusted by 375,005 students
Access to over 1.5 million titles for a fair monthly price.
Study more efficiently using our study tools.
Information
1
What is Mathematical Modelling?
There are three natural questions to ask at the beginning of this book
• why study mathematical modelling?
• what is a mathematical model?
• how do we find mathematical models?
Broadly speaking
• mathematical modelling provides a method for solving problems mathematically
• a mathematical model is a mathematical representation of the relationship between two or more variables relevant to a given situation or problem
• finding mathematical models is a skill that we hope you will develop in this course.
In this first chapter we begin to explore these questions and illustrate the answers through simple problem situations.
1.1 Modelling with data
One of the simplest mathematical models is a linear one which represents the relation between two variables by a straight line graph. In some cases the variables given in the problem satisfy a linear relation, but in other situations we might have to transform the variables to obtain a straight line graph.
For example, a common method of transformation is the use of logarithms. If the variables x and y satisfy a power law relation, y = abx, then a graph of y against x will produce a curve as shown in Fig 1.1a. However, taking logarithms of each side gives
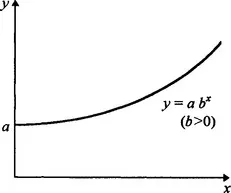
Fig 1.1a Graph of y against

and a graph of log y against x will give a straight line (as in Fig 1. lb). From the properties of the second graph we can estimate the values of a and b.
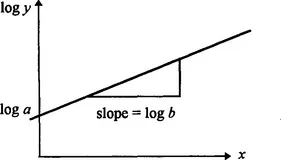
Fig 1.1b Graph of log y against x
In the following two examples we illustrate the graphical approach to problem solving.
EXAMPLE 1 Modelling ‘the greenhouse effect’
The burning of fossil fuels such as coal and oil adds carbon dioxide to the atmosphere around the earth. This may be partly removed by biological reactions, but the concentration of carbon dioxide is gradually increasing. This increase leads to a rise in the average temperature of the earth. Table 1.1 shows this temperature rise over the one hundred year period up to 1980.
Table 1.1
The temperature rise of the earth over 100 years
| Year | Temperature rise of the earth above the 1860 figure (°C) |
| 1880 | 0.01 |
| 1896 | 0.02 |
| 1900 | 0.03 |
| 1910 | 0.04 |
| 1920 | 0.06 |
| 1930 | 0.08 |
| 1940 | 0.10 |
| 1950 | 0.13 |
| 1960 | 0.18 |
| 1970 | 0.24 |
| 1980 | 0.32 |
If the average temperature of the earth rises by about another 6°C from the 1980 value this would have a dramatic effect on the polar ice caps, winter temperature etc. As the polar ice caps melt, there could be massive floods and a lot of land mass would be submerged. The UK would disappear except for the tops of the mountains!
Find a model of the above data and use it to predict when the earth’s temperature will be 7°C above its 1860 value.
Solution
In this problem the variables are
• the temperature rise of the earth above the 1860 figure, T, and
• the year, n.
There is no simple way of discovering a relation between the temperature rise and the year by pure thought There are many complicated processes going on in the atmosphere, and the effect on the atmosphere of burning fossil fuels will involve several physical laws and chemical reactions. However, we can make progress by representing the data graphically. It is probably quite clear to you that this set of data will not lead to a straight line graph and Fig 1.2 emphasises this point.

Fig 1.2 Graph of T a...
Table of contents
- Cover image
- Title page
- Table of Contents
- Other titles in this series
- Copyright
- Series Preface
- Preface
- Chapter 1: What is Mathematical Modelling?
- Chapter 2: Modelling Population Growth
- Chapter 3: Mathematical Modelling in Action
- Chapter 4: Developing Modelling Skills
- Answers to Selected Problems
- Index of Modelling Problems
- Index
Frequently asked questions
Yes, you can cancel anytime from the Subscription tab in your account settings on the Perlego website. Your subscription will stay active until the end of your current billing period. Learn how to cancel your subscription
No, books cannot be downloaded as external files, such as PDFs, for use outside of Perlego. However, you can download books within the Perlego app for offline reading on mobile or tablet. Learn how to download books offline
Perlego offers two plans: Essential and Complete
- Essential is ideal for learners and professionals who enjoy exploring a wide range of subjects. Access the Essential Library with 800,000+ trusted titles and best-sellers across business, personal growth, and the humanities. Includes unlimited reading time and Standard Read Aloud voice.
- Complete: Perfect for advanced learners and researchers needing full, unrestricted access. Unlock 1.5M+ books across hundreds of subjects, including academic and specialized titles. The Complete Plan also includes advanced features like Premium Read Aloud and Research Assistant.
We are an online textbook subscription service, where you can get access to an entire online library for less than the price of a single book per month. With over 1.5 million books across 990+ topics, we’ve got you covered! Learn about our mission
Look out for the read-aloud symbol on your next book to see if you can listen to it. The read-aloud tool reads text aloud for you, highlighting the text as it is being read. You can pause it, speed it up and slow it down. Learn more about Read Aloud
Yes! You can use the Perlego app on both iOS and Android devices to read anytime, anywhere — even offline. Perfect for commutes or when you’re on the go.
Please note we cannot support devices running on iOS 13 and Android 7 or earlier. Learn more about using the app
Please note we cannot support devices running on iOS 13 and Android 7 or earlier. Learn more about using the app
Yes, you can access Mathematical Modelling by John Berry,Ken Houston in PDF and/or ePUB format, as well as other popular books in Mathematics & Applied Mathematics. We have over 1.5 million books available in our catalogue for you to explore.