Evaluating Climate Change Impacts discusses assessing and quantifying climate change and its impacts from a multi-faceted perspective of ecosystem, social, and infrastructure resilience, given through a lens of statistics and data science. It provides a multi-disciplinary view on the implications of climate variability and shows how the new data science paradigm can help us to mitigate climate-induced risk and to enhance climate adaptation strategies.
This book consists of chapters solicited from leading topical experts and presents their perspectives on climate change effects in two general areas: natural ecosystems and socio-economic impacts. The chapters unveil topics of atmospheric circulation, climate modeling, and long-term prediction; approach the problems of increasing frequency of extreme events, sea level rise, and forest fires, as well as economic losses, analysis of climate impacts for insurance, agriculture, fisheries, and electric and transport infrastructures. The reader will be exposed to the current research using a variety of methods from physical modeling, statistics, and machine learning, including the global circulation models (GCM) and ocean models, statistical generalized additive models (GAM) and generalized linear models (GLM), state space and graphical models, causality networks, Bayesian ensembles, a variety of index methods and statistical tests, and machine learning methods. The reader will learn about data from various sources, including GCM and ocean model outputs, satellite observations, and data collected by different agencies and research units. Many of the chapters provide references to open source software R and Python code that are available for implementing the methods.
Trusted by 375,005 students
Access to over 1.5 million titles for a fair monthly price.
Statistical Issues in Detection of Trends in Losses from Extreme Weather and Climate Events
Richard W. Katz
National Center for Atmospheric Research, Boulder, CO, USA
CONTENTS
8.1Introduction
8.2Loss distribution
8.2.1Overall distribution of losses
8.2.2Distribution of extreme high losses
8.2.3Reconciling implications for extremes
8.3Bias, uncertainty, and variability in losses
8.3.1Variability and uncertainty as sources of bias
8.3.2Effects of adjustments
8.4Detection and attribution of trends in losses
8.4.1Random sum representation
8.4.2Trend analyses
8.4.3Issues in normalization of losses
8.5Summary and discussion
References
8.1Introduction
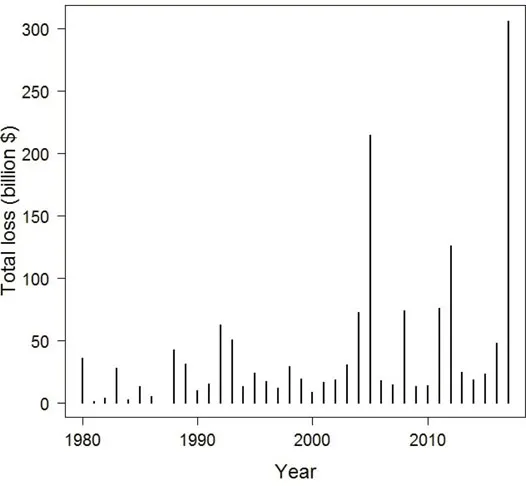
Losses from extreme weather and climate events, such as floods or hurricanes, receive considerable attention, especially as a possible indicator of climate variations or change. As an example, Figure 8.1 shows the time series of the annual total economic loss (adjusted for inflation to constant 2017 dollars using the US Consumer Price Index) from US billion-dollar weather and climate disasters for the period 1980–2017 (updated from Smith and Katz, 2013, see www.ncdc.noaa.gov/billions/). The total damage for the last year in the record 2017 stands out, being dominated by damage caused by Hurricane Harvey striking Texas, Hurricane Irma striking Florida, and Hurricane Maria striking Puerto Rico. Another year that stands out is 2005 in which Hurricane Katrina struck Louisiana, constituting the highest loss from a single event (over $160 billion in 2017 dollars). While the plot suggests an apparent long-term increasing trend, more noticeable is the incredible magnitude of fluctuations in total loss from year to year.
Figure 8.1: Annual total economic losses from US billion-dollar weather and climate disasters (adjusted for inflation to constant 2017 dollars) for period 1980–2017.
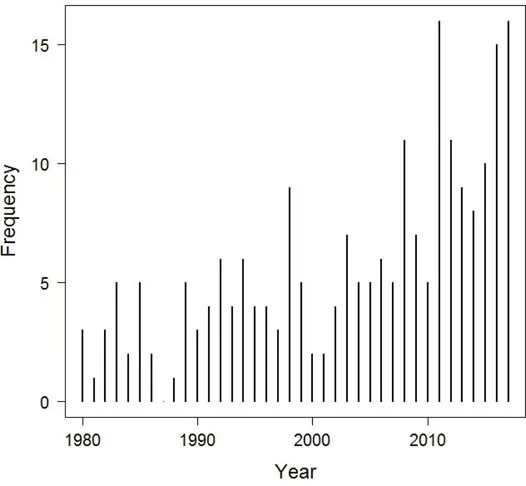
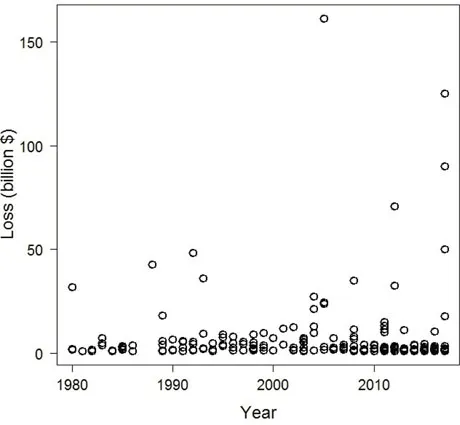
The annual total losses shown in Figure 8.1 have two sources of variation: (i) variations in the annual number of disasters (for example, see Chapter 2 on the changes in the records of North Atlantic tropical cyclones); and (ii) variation in the losses from individual events. As such, the annual total loss can be viewed as a “random sum” (Embrechts et al, 1997, Katz, 2002). Figure 8.2 shows the time series of annual frequency of US billion-dollar weather and climate disasters, source (i) of variation in the annual total losses. A marked increasing trend is obvious with by far the highest frequencies occurring near the end of the record, 16 disasters in both the years 2011 and 2017 and 15 disasters in 2016. Figure 8.3 shows the losses from individual events versus the year, source (ii) of variation in the annual total losses. These variations are quite erratic, with any increasing trend not necessarily being obvious. Instead, most striking is the highly skewed distribution of losses, with the losses for the vast majority of disasters being at least an order of magnitude smaller than the highest values (of course, by definition all losses in this data set are at least $1 billion US dollars). We will apply extreme value theory to fit a generalized Pareto distribution to extreme high losses (Coles, 2001). Then we will compare this analysis with the traditional approach of fitting a lognormal distribution to all the loss data (e.g., Nordhaus, 2010).
Figure 8.2: Annual frequency of US billion-dollar weather and climate disasters for period 1980–2017.
Figure 8.3: Losses from individual US billion-dollar weather and climate disasters for period 1980–2017.
In trend analysis of time series of losses, one complication is isolating the influence of weather and climate extremes. The effects of shifts in societal vulnerability, including higher population and capital that is more valuable, dominate time series of losses. Thus, we cannot attribute any observed trend in losses to climate change alone. For this reason, we will also consider losses from hurricanes alone, normalized for shifts in societal vulnerability.
Hurricanes (technically, a few were tropical cyclones not attaining hurricane status) making landfall along the Gulf and Atlantic coasts of the US are the weather or climate phenomenon causing the most loss among billion-dollar disasters (Smith and Katz, 2013). As such, losses caused by hurricanes have received more attention, resulting in higher quality estimates than for other loss data (e.g., for floods). Further, Pielke Jr et al (2008) created a normalized hurricane loss data set for the period 1900–2005, adjusted for both inflation and shifts in societal vulnerability to the year 2005. For purposes of trend analysis, the time series of hurricane losses has the advantage of being considerably longer than the billion-dollar weather and climate disaster data set, although not extending as close to the present. We note that the hurricane loss data set does not constitute simply a subset of the billion-dollar disaster data set. Rather it consists of losses from essentially all hurricanes (i.e., not just those losses exceeding a billion dollars), but only accounts for the effects of high winds (hurricane losses in the billion-dollar disaster data set consist of combined losses caused by both wind and flooding).
In this chapter, we first characterize the statistical distribution of losses caused by extreme weather and climate events, including an attempt to reconcile the common use of the lognormal distribution for ...
Table of contents
Cover
Half Title
Title Page
Copyright Page
Contents
Preface
I. Ecosystem Impacts
II. Socioeconomic Impacts
Index
Frequently asked questions
Yes, you can cancel anytime from the Subscription tab in your account settings on the Perlego website. Your subscription will stay active until the end of your current billing period. Learn how to cancel your subscription
No, books cannot be downloaded as external files, such as PDFs, for use outside of Perlego. However, you can download books within the Perlego app for offline reading on mobile or tablet. Learn how to download books offline
Perlego offers two plans: Essential and Complete
Essential is ideal for learners and professionals who enjoy exploring a wide range of subjects. Access the Essential Library with 800,000+ trusted titles and best-sellers across business, personal growth, and the humanities. Includes unlimited reading time and Standard Read Aloud voice.
Complete: Perfect for advanced learners and researchers needing full, unrestricted access. Unlock 1.5M+ books across hundreds of subjects, including academic and specialized titles. The Complete Plan also includes advanced features like Premium Read Aloud and Research Assistant.
Both plans are available with monthly, semester, or annual billing cycles.
We are an online textbook subscription service, where you can get access to an entire online library for less than the price of a single book per month. With over 1.5 million books across 990+ topics, we’ve got you covered! Learn about our mission
Look out for the read-aloud symbol on your next book to see if you can listen to it. The read-aloud tool reads text aloud for you, highlighting the text as it is being read. You can pause it, speed it up and slow it down. Learn more about Read Aloud
Yes! You can use the Perlego app on both iOS and Android devices to read anytime, anywhere — even offline. Perfect for commutes or when you’re on the go. Please note we cannot support devices running on iOS 13 and Android 7 or earlier. Learn more about using the app
Yes, you can access Evaluating Climate Change Impacts by Vyacheslav Lyubchich, Yulia Gel, K. Halimeda Kilbourne, Thomas James Miller, Nathaniel K. Newlands, Adam B. Smith, Vyacheslav Lyubchich,Yulia Gel,K. Halimeda Kilbourne,Thomas James Miller,Nathaniel K. Newlands,A. Smith,Adam B. Smith, Vyacheslav Lyubchich, Yulia Gel, K. Halimeda Kilbourne, Thomas James Miller, Nathaniel K. Newlands, A. Smith in PDF and/or ePUB format, as well as other popular books in Biological Sciences & Environmental Economics. We have over 1.5 million books available in our catalogue for you to explore.