- 150 pages
- English
- ePUB (mobile friendly)
- Available on iOS & Android
eBook - ePub
About this book
Carbon capture and storage is one of the main carbon emissions policy issues globally, yet you may know little about it if you're outside the academic community. As the global push to address the impact that carbon emissions has on global warming continues, awareness and knowledge of viable solutions must be communicated in layperson terms. Returning Coal and Carbon To Nature breaks across traditional barriers among history, geology, biology and climate change to address the topic from a multidisciplinary, Earth System Science approach. If you're a policymakeror someone who influences policy, this book will explain carbon capture and storage—a relatively new concept—in easy-to-understand terms. Clearly presented charts, tables and diagrams explain critical concepts, and a range of full-color photographs will help you visualize the carbon capture and storage process and its principles.
- Discusses carbon capture and storage in terms easily accessible to a range of stakeholders, including policymakers worldwide and geoscientists who influence policy.
- The first cross-disciplinary look at the history, geology and biology of coal, and presents carbon capture and storage in the context of Earth System Science.
- Authored by one of the world's foremost carbon capture and storage experts who has more than 30 years of field research experience.
Trusted by 375,005 students
Access to over 1.5 million titles for a fair monthly price.
Study more efficiently using our study tools.
Information
Chapter 1
Of Hockey Sticks and Coal
Coal and the Industrial Revolution
Where is the Coal?
Use of Coal in the Future
Coal in India
Coal in China
Coal in South Africa
Solving the Problem of Coal Use
Bibliography
Most people have heard of the hockey stick graph in relation to global warming. The term was first used by the climatologist Jerry Mahlman who pointed out the shape of global temperature change through time was approximately flat up to about 1900 apart from the ‘medieval warm period’ and the ‘little ice age’ (the shaft of the stick), and then rapidly upturned into a ‘blade’ which got steeper with time. The hockey stick graph for CO2 is rather more uniform in shape but broadly similar as might be expected since the chief control on temperature rise is believed to be the atmospheric content of CO2. In this chapter I’ll look at the shape of the CO2 hockey stick graph and the part that coal had in creating it. I’ll also look at the future for coal.
In June 2012 the concentration of CO2 in the atmosphere reached 395 parts per million by volume (ppmv) or 0.000395%. It has been rising at about 2 ppmv every year since 2000. We can be absolutely sure of these amounts because since 1958 they have been measured directly from the atmosphere at Mauna Loa in Hawaii. Before that date we rely on more indirect measurements of bubbles of air trapped in cores of ice from Antarctica and Greenland. Antarctic cores show that atmospheric CO2 levels were about 260–280 ppmv immediately before industrial emissions began in the mid-eighteenth century and did not vary much from this level during the preceding 10,000 years. Going back 400,000 years, which is possible by looking at progressively deeper and deeper ice, a pattern of CO2 concentration is revealed which synchronizes with ice age cycles (Figure 1.1), but nowhere is there a sign of such a large leap of CO2 concentration nor a rate of increase so extreme as in the last few decades.
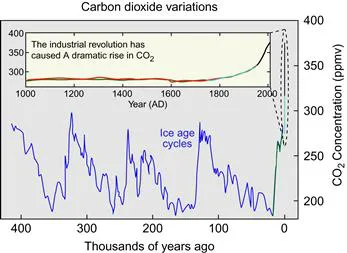
Figure 1.1 Carbon dioxide variation in the last 400,000 years. Inset shows the variation since 1000 AD. From Wikipedia.
To understand what part coal might have played in increasing CO2 levels we need to know the fluxes of CO2 in and out of the atmosphere, both natural and man-made. Volcanoes belch out CO2 during eruptions but the natural burning of peat, wildfires, oxidation of organic matter in exposed rock and the respiration processes of living things, also all produce CO2. Of course human beings breathe out CO2. In fact we breathe out about 5% CO2 or about 25 ml with each breath. Taking an average of 13,000 breaths a day an average person exhales about 1 kg of CO2.
Man-made industrial sources of carbon dioxide include burning of fossil fuels for heating, power generation and transport, as well as processes such as cement and ammonia manufacture.
What about processes that take CO2 out of the atmosphere? Plants convert carbon dioxide to carbohydrates during photosynthesis. They gain the energy needed for this reaction through the absorption of sunlight by pigments such as chlorophyll. The resulting gas, oxygen, is released into the atmosphere, and then used for respiration by animals and other plants, forming a cycle, which is part of the larger carbon cycle. Weathering of rocks containing silicate minerals also sucks CO2 from the atmosphere converting it to insoluble and soluble carbonates.
The inputs and outputs of CO2 to and from the atmosphere are nearly balanced. For example, the natural decay of organic material in forests and grasslands, and forest fires, releases about 439 gigatonnes (a gigatonne is a billion tonnes) of carbon dioxide every year, while new plant growth more than counteracts this effect, absorbing 450 gigatonnes per year. Although the carbon dioxide in the atmosphere of the ancient Earth shortly after its formation was produced by volcanic activity, modern volcanic activity releases only 130–230 megatonnes (million tonnes) of carbon dioxide each year, which is less than 1% of the amount released by human activities (at approximately 29 gigatonnes). In the pre-industrial era these fluxes were largely in balance. Now the balance is lost because of increased man-made CO2 emissions: currently only about 57% of human-emitted CO2 is removed by the biosphere and oceans, so man-made CO2 is on the rise.
Direct evidence that this increase is from fossil fuel burning comes from the isotopic composition of the carbon in the CO2 of the atmosphere through time (Figure 1.2). Carbon occurs naturally in the form of three isotopes 14C, 13C and 12C, and the ratios of the different isotopes are quite significant. The graph shows the isotopic ratio of the isotopes 13C: 12C which is known as δ13C and is expressed in parts per thousand using the symbol ‰ (the equivalent of a percentage but based on a thousand).
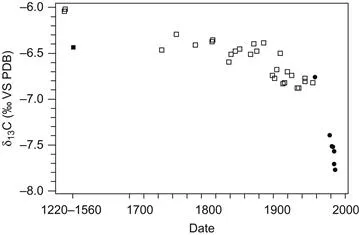
Figure 1.2 δ13C records of the carbon in atmospheric CO2 from Mauna Loa Observatory and ice core from South Pole ice. The trend is clearly decreasing. Circles from Mauna Loa Observatory and squares from South Pole ice. From Ghosh and Brand (2003).
The graph shows that in the last 200 years the δ13C of CO2 in the atmosphere has decreased by 1.5‰. Ice core data show the trend across a greater time period (from 1700 AD) with a particular increase in the steepness of the curve at about 1800, not long after the start of the industrial revolution.
So what’s happened? It’s partly a matter of dilution of atmospheric CO2 with older carbon in CO2 released from fossil fuels. The carbon in CO2 that’s released from burning coal, gas and oil has much lower δ13C than atmospheric CO2. It’s old because it was incorporated into ancient plants millions of years ago and then formed into coal. For example the carbon in 300 million-year-old Carboniferous coal has a δ13C of between −23 and −24‰ because this was the δ13C in the plant tissues that formed the coal. This is much lower than the δ13C of the CO2 in the modern atmosphere (about −8‰), and so when the low δ13C CO2 of the burned Carboniferous coal enters the atmosphere, the δ13C in the mix of modern atmospheric CO2 decreases. The changing values of δ13C through time as shown in the graph are also interesting because they in turn will be incorporated into modern plants as time goes by. In the next chapter I’ll explain how this is useful in understanding the long-term carbon cycle.
More circumstantial evidence of the connection between fossil fuels and CO2 in the atmosphere comes by simple comparison of historical data on fossil fuel burning and CO2 concentration. This was shown by David MacKay in his excellent book Sustainable Energy without the Hot Air. Mackay simply drew graphs of coal and oil burning on the same horizontal axis as for CO2 concentration (Figure 1.3). In the vertical axis in his lower graph he used a rather unfamiliar unit of gigatonnes of CO2 per year (GtCO2 per year). Rather than the number of barrels or tonnes of oil and coal used, this is a figure that shows how much CO2 was emitted from burning those barrels of oil or tonnes of coal.
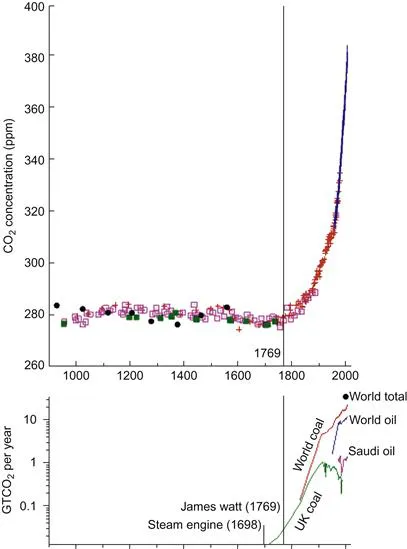
Figure 1.3 Atmospheric CO2 concentration and historical fossil fuel usage. The first steam engine was invented in 1698, but James Watt patented his steam engine in 1769. From MacKay (2009).
The similarity of the curves is striking. The upper curve – the CO2 hockey stick – has an exact counterpart in the lower curve. Also striking is the relationship with advances such as the development of the steam engine.
In this section we’ve seen that increasing CO2 is a mainly a result of industrial activity. The smokestacks of power stations, cement factories and oil refineries are the smoking guns of the rapid CO2 rise. In the next section I’ll look at how human society became so attached to coal in the industrial revolution and explain why coal was such an integral part of it. I’ll also show how the emerging economies of the eighteenth century were already reliant on coal.
Coal and the Industrial Revolution
Neither medieval coal miners nor later historians looking at the map of British coalfields operating in 1700 (Figure 1.4) would have been aware that their distribution is partly a consequence of the 300-million-old arrangement of swamps and subsiding land close to an emerging mountain range. This is something we’ll examine later in this book. But the distribution of coal either at or near the surface in eighteenth century England affected the development of industry, and before that the development of trade in coal primarily for domestic heating.
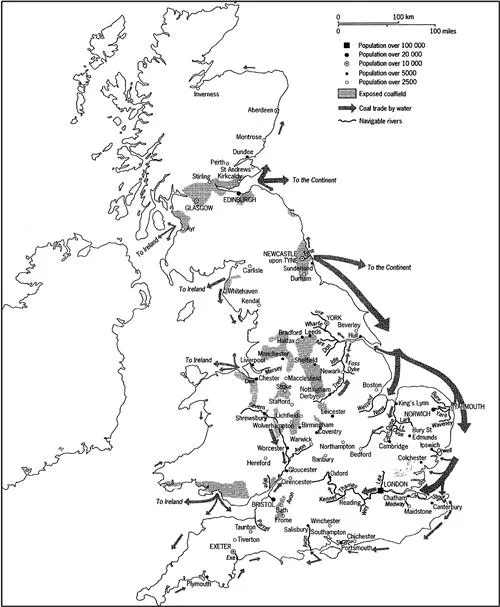
Figure 1.4 Coalfields and trade routes in Britain in 1700. Much coal was supplied down the east coast from Newcastle to the Midlands and London. From Hatcher (1993).
Even in Roman Britain a small trade had developed along the North Sea coast supplying coal to London but by the middle of the sixteenth century supplies of wood for household heating were running out, particularly in the larger towns, and so the use of coal as a domestic fuel increased rapidly. By the beginning of the eighteenth century coal output in Britain was many times greater than that in the whole of the rest of the world.
Britain had a rising population – the population doubled between the early sixteenth century and the mid-seventeenth century – and many of these new people lived in towns far from the land that produced firewood. Firewood increased hugely in price with the result that coal very soon became the cheapest fuel, especially in towns along the east coast of England, including London, which could get coal by sea from the northeast. In the early seventeenth century much of Britain’s dependence on coal was already established. By 1700, according to Hatcher (1993) fossil fuels had already ‘eclipsed plant fuels as the leading provider of the nation’s heat’.
In this early period water transport by canal or by sea was the only feasible method of moving large quantities of coal. All the large collieries were close to water, the biggest being in the northeast. By around 1700, 700,000 tonnes of coal then costing £125,000–£130,000 were shipped annually from the northeast.
Things changed in the mid-eighteenth century. In 1769 James Watt patented his steam engine. This created a demand for coal apart from domestic heating, but also allowed mines to go deeper because the steam engines were connected to pumps that drained the deep mines below the water table. Before this, much less efficient chain pumps driven by water wheels drained the collieries. At deep levels firedamp (what geologists would now call coal bed methane) collected at great hazard to miners, and air circulation was originally ...
Table of contents
- Cover image
- Title page
- Table of Contents
- Copyright
- Dedication
- Preface
- Acknowledgements
- Chapter 1. Of Hockey Sticks and Coal
- Chapter 2. The Negative Greenhouse
- Chapter 3. Capturing Carbon Dioxide
- Chapter 4. Returning Carbon to Nature
- Chapter 5. Will It Leak?
- Chapter 6. Accounting for Carbon
Frequently asked questions
Yes, you can cancel anytime from the Subscription tab in your account settings on the Perlego website. Your subscription will stay active until the end of your current billing period. Learn how to cancel your subscription
No, books cannot be downloaded as external files, such as PDFs, for use outside of Perlego. However, you can download books within the Perlego app for offline reading on mobile or tablet. Learn how to download books offline
Perlego offers two plans: Essential and Complete
- Essential is ideal for learners and professionals who enjoy exploring a wide range of subjects. Access the Essential Library with 800,000+ trusted titles and best-sellers across business, personal growth, and the humanities. Includes unlimited reading time and Standard Read Aloud voice.
- Complete: Perfect for advanced learners and researchers needing full, unrestricted access. Unlock 1.5M+ books across hundreds of subjects, including academic and specialized titles. The Complete Plan also includes advanced features like Premium Read Aloud and Research Assistant.
We are an online textbook subscription service, where you can get access to an entire online library for less than the price of a single book per month. With over 1.5 million books across 990+ topics, we’ve got you covered! Learn about our mission
Look out for the read-aloud symbol on your next book to see if you can listen to it. The read-aloud tool reads text aloud for you, highlighting the text as it is being read. You can pause it, speed it up and slow it down. Learn more about Read Aloud
Yes! You can use the Perlego app on both iOS and Android devices to read anytime, anywhere — even offline. Perfect for commutes or when you’re on the go.
Please note we cannot support devices running on iOS 13 and Android 7 or earlier. Learn more about using the app
Please note we cannot support devices running on iOS 13 and Android 7 or earlier. Learn more about using the app
Yes, you can access Returning Carbon to Nature by Michael H. Stephenson in PDF and/or ePUB format, as well as other popular books in Technology & Engineering & Environmental Science. We have over 1.5 million books available in our catalogue for you to explore.