Coastal Acoustic Tomography begins with the specifics required for designing a Coastal Acoustic Tomography (CAT) experiment and operating the CAT system in coastal seas. Following sections discuss the procedure for data analyses and various application examples of CAT to coastal/shallow seas (obtained in various locations). These sections are broken down into four kinds of methods: horizontal-slice inversion, vertical-slice inversion, modal expansion method and data assimilation. This book emphasizes how dynamic phenomena occurring in coastal/shallow seas can be analyzed using the standard method of inversion and data assimilation.
The book is relevant for physical oceanographers, ocean environmentalists and ocean dynamists, focusing on the event being observed rather than the intrinsic details of observational processes. Application examples of successful dynamic phenomena measured by coastal acoustic tomography are also included.
- Provides the information needed for researchers and graduate students in physical oceanography, ocean-fluid dynamics and ocean environments to apply Ocean Acoustic Tomography (OAT) to their own fields
- Presents the benefits of using acoustic tomography, including less disturbance to aquatic environments vs. other monitoring methods
- Includes the assimilation of CAT data into a coastal sea circulation model, a powerful tool to predict coastal-sea environmental changes
Trusted by 375,005 students
Access to over 1.5 million titles for a fair monthly price.
Ocean acoustic tomography (OAT) was proposed by Walter Munk of Scripps Institution of Oceanography in 1970s. Information from seismic and medical tomography served as a precursor technology to realize OAT. Especially, advanced inversion methods have been imported from seismic tomography. The first OAT experiment was carried out in 1981 to map the temperature structures of mesoscale eddies with 100–300 km scales, pinched off from the Gulf Stream and drifted to the Bermuda Sea. In this experiment, underwater sound channel played an essential role in long-range sound transmission over about 300 km. The thermal structures of mesoscale eddies reconstructed by the inverse analysis of one-way travel-time data between the arrayed source and receiver were validated with conductivity–temperature–depth and AXBT data, performed during and before/after sound transmission. In the remaining period of 1980s, intensive tomography experiments were succeeded in the North Atlantic Ocean and the Mediterranean Sea in collaboration of the US and European OAT groups. Time-varying temperature fields with deep water formation were targeted in the experiment and their thermal structures were first measured under careful consideration of positioning accuracy such that the position of subsurface acoustic transmitters on mooring lines was tracked by triangular-arrayed transponders at the seafloor, increasing the operation cost of the mooring system. Sufficient positioning accuracy for temperature measurement may be hopeless without tracking mooring line motion.
Keywords
Mesoscale; ocean acoustic tomography; underwater sound channel; North Atlantic Ocean; temperature structure; precise positioning accuracy
1.1 Ocean Acoustic Tomography
Ocean acoustic tomography (OAT) was proposed by Walter Munk of Scripps Institution of Oceanography in 1970s (Munk and Wunsch, 1979). Information from seismic (Aki and Richards, 1980) and medical tomography served as a precursor technology to realize OAT. Especially, advanced inversion methods have been imported from seismic tomography. The first OAT experiment was carried out in 1981 to map the temperature structures of mesoscale eddies with 100–300 km scales, pinched off from the Gulf Stream and drifted to the Bermuda Sea (The Ocean Tomography Group, 1982). In this experiment, underwater sound channel (USC) played an essential role in long-range sound transmission over about 300 km. The thermal structures of mesoscale eddies reconstructed by the inverse analysis of one-way travel-time data between the arrayed sources to receivers were validated with conductivity–temperature–depth (CTD) and airborne expendable bathythermograpgh (AXBT) data, performed during and before/after sound transmission. In the remaining period of 1980s, intensive tomography experiments were succeeded in the North Atlantic Ocean and the Mediterranean Sea in collaboration of the US and European OAT groups. Time-varying temperature fields with deep water formation were targeted in the experiment and their thermal structures were first measured under careful consideration of positioning accuracy such that the position of subsurface acoustic transmitters on mooring lines was tracked by triangular-arrayed transponders at the seafloor, increasing the operation cost of the mooring system. Sufficient positioning accuracy for temperature measurement may be hopeless without tracking mooring line motion.
In 1990s the Japanese OAT group, initiated by Japan Agency for Marine-Earth Science and Technology Center, started the tomography experiments in the North Pacific Ocean in collaboration with the US and European OAT groups. By using a 200 Hz pressure-compensated type acoustic transceiver, observation range was extended up to about 1000 km. Eddy-embedded thermal structures in the North Equatorial Current and the Kuroshio Extension were successfully reconstructed by the stochastic inverse (Gauss–Markov’s method) accompanied by the function expansion of sound-speed deviation fields (Yuan et al., 1999). In contrast to thermal structures, the tomographic measurement of current velocity structures, which requires strict clock accuracy rather than positioning accuracy, was rare because a continuous, long-term operation of atomic clock in the underwater was difficult owing to intolerable power consumption.
Although the instrumentation and methodology for deep-sea operation and the inversion methods for analyzing deep-sea tomography data were well established until the end of the 20th century, the driving force on OAT studies was remarkably weakened in the oceanographic community in the first decade of the 21st century. This unexpected situation may be mainly caused by heavy instrumentation cost required for a long-term operation of OAT mooring arrays in the deep sea. The heavy instrumentation cost also prohibited a worldwide operation of deep-sea tomography systems by common oceanographers, who were not supported with big project funds and not specialized in ocean acoustics. Thus oceanographers lost the first chance of operational use of OAT, which may be a central instrument in Eulerian methods. In the second decade of the 21st century, deep-sea OAT experiment restarted in the Fram Strait (Sagen et al., 2016; Dushaw et al., 2016a,b) and Canary Basin (Dushaw et al., 2017) by the specialized organizations supported by a huge fund, targeting a long-term monitoring of strait throughflow for warming in the arctic sea and the tracking of meddies wandering the North Atlantic Ocean around the exit (the Gibraltar Strait) of the Mediterranean Sea, respectively. In spite of the past tremendous effort, which has been devoted to OAT, OAT could not reach an operational phase unlike other standard oceanographic instruments characterized with a cost-efficient performance, such as acoustic Doppler current profiler (ADCP) moorings, Argo floats, high frequency (HF) ocean radars, and inverted echo sounders.
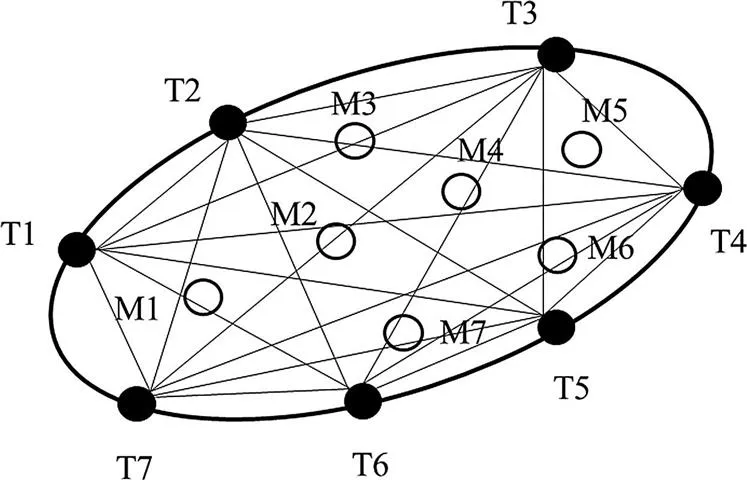
OAT is an advanced oceanographic technology, which can make a simultaneous mapping (snapshot) of time-varying subsurface structures of current velocity and sound speed (mainly temperature) with a speed of about 1.5 km s−1 using underwater sound channel. In OAT, observation domain is surrounded by multiacoustic stations and reciprocal sound transmission is performed between these station pairs. Data are the travel times (time-of-flight), which are obtained along acoustic ray paths and converted to path-average current velocity and sound speed through standard equations. The accuracy of observed data is remarkably improved through a path integral along the ray. The superiority of OAT is well understood in comparison with the data obtained by conventional one-point sensors, such as current meters, and the profiling data by ADCP. Furthermore, an advantage of OAT moorings in comparison with conventional current-meter moorings is pronounced with increasing number of mooring lines. In the case of OAT mooring array with seven acoustic stations (Fig. 1.1), the number of sound-transmission lines (data number) is 7C2=21 significantly greater than the data number of 7 for conventional current-meter moorings. The reduced number of mooring lines required for attaining the same spatial resolution as conventional moorings becomes a further advantage because the shipboard work imposed on deep-sea moorings is one of the heaviest duties in observational oceanography.
Figure 1.1 Sketch of the OAT array composed of seven acoustic stations. T1–T7 are the acoustic stations and the straight lines connecting the stations are the sound-transmission lines projected to a horizontal slice. Circles are the positions of conventional current-meter mooring (M1–M7) with the same number as the OAT array. OAT, Ocean acoustic tomography.
As for horizontal-slice tomography as sketched in Fig. 1.1, acoustic rays are usually approximated with straight lines owing to negligibly small horizontal refraction of sound and horizontal resolution
is calculated by the following formula:
(1.1)
(1.1)
where A is the area of tomography domain spanned by rays of the number of M. It provides only an average resolution, although ray distribution is usually not uniform. In OAT, which uses along-path information, data are acquired along the ray paths. Thus no information is obtained in subspaces surrounded by each ray. Fine horizontal resolution is attained in the regions with a dense distribution of rays and around the regions, where rays make crossing points. Data in the regions with noncrossing of rays may be produced by an interpolation by the use of information from the neighboring rays.
1.1.1 Break Corner (Projected Rays on a Horizontal Slice)
Rays on a horizontal slice are not real, but ones projected from real, refracted rays on a vertical slice. They are well approximated by straight lines because the gradient of sound speed, constructed mainly by temperature, is much smaller in the horizontal direction than in the vertical one. While the vertical stratification of temperature is constructed by solar radiation absorbed downward from the surface, the horizontal variation of solar radiation is negligible at oceanic scales ranging from the small to meso, which OAT mainly targets. Thus sound refraction is slight on the horizontal slice and the projected rays are nearly straight.
1.2 Advancement by Coastal Acoustic Tomography
For OAT, which can use the USC, acoustic transceivers are preferable to locate near the channel axis that is constructed at the bottom of main (permanent) thermocline (Fig. 1.2). By setting acoustic transceivers at the USC axis, rays are distributed over a wide range of depth from the surface to axis, constructing different travel times, which make vertical-slice inversion valid. Baroclinic ocean variability is generally strong around the main thermocline with a large gradient of temperature and significantly weakened at the bottom of the thermocline, corresponding to the USC axis. Ocean currents are generally confined to the upper ocean from the surface to the mail thermocline and weakened near the USC axis at the bottom of the main thermocline. OAT moorings with an acoustic transceiver near the USC axis, characterized with weak current, provide more cost-effective and eas...
Table of contents
Cover image
Title page
Table of Contents
Copyright
Preface
Chapter 1. Fundamental Knowledge
Chapter 2. Instrumentation
Chapter 3. Sound Transmission and Reception
Chapter 4. Range-Average Measurement
Chapter 5. Forward Formulation
Chapter 6. Inversion on a Horizontal Slice
Chapter 7. Inversion on a Vertical Slice
Chapter 8. Data Assimilation
Chapter 9. Applications for Horizontal-Slice Inversion
Chapter 10. Applications for Vertical-Slice Inversion
Chapter 11. Applications for Data Assimilation
Chapter 12. Modal Function Expansion With Coastline Constraints
Chapter 13. Application to Various Fields and Phenomena
Yes, you can cancel anytime from the Subscription tab in your account settings on the Perlego website. Your subscription will stay active until the end of your current billing period. Learn how to cancel your subscription
No, books cannot be downloaded as external files, such as PDFs, for use outside of Perlego. However, you can download books within the Perlego app for offline reading on mobile or tablet. Learn how to download books offline
Perlego offers two plans: Essential and Complete
Essential is ideal for learners and professionals who enjoy exploring a wide range of subjects. Access the Essential Library with 800,000+ trusted titles and best-sellers across business, personal growth, and the humanities. Includes unlimited reading time and Standard Read Aloud voice.
Complete: Perfect for advanced learners and researchers needing full, unrestricted access. Unlock 1.5M+ books across hundreds of subjects, including academic and specialized titles. The Complete Plan also includes advanced features like Premium Read Aloud and Research Assistant.
Both plans are available with monthly, semester, or annual billing cycles.
We are an online textbook subscription service, where you can get access to an entire online library for less than the price of a single book per month. With over 1.5 million books across 990+ topics, we’ve got you covered! Learn about our mission
Look out for the read-aloud symbol on your next book to see if you can listen to it. The read-aloud tool reads text aloud for you, highlighting the text as it is being read. You can pause it, speed it up and slow it down. Learn more about Read Aloud
Yes! You can use the Perlego app on both iOS and Android devices to read anytime, anywhere — even offline. Perfect for commutes or when you’re on the go. Please note we cannot support devices running on iOS 13 and Android 7 or earlier. Learn more about using the app
Yes, you can access Coastal Acoustic Tomography by Arata Kaneko,Xiao-Hua Zhu,Ju Lin in PDF and/or ePUB format, as well as other popular books in Naturwissenschaften & Geophysik. We have over 1.5 million books available in our catalogue for you to explore.