Economics of Aquaculture presents basic economic theory in a concise and logical format which is easily adaptable to practical application. Examples of economic solutions to common problems help you understand the need for economic application to aquaculture and the success that may come with sound economic planning and management. It also provides coverage of virtually all basic principles of microeconomics, farm management finance, and marketing applicable to the aquacultural industry. You will "walk" through the intricate maze of decisions which are necessary for success in the business environment.The regular and on-going business of aquacultural production and marketing is addressed as a continuous problem set for the student or producer. Business decisions are shown to be logical extensions of those in production and vice versa. A successful producer must be a successful business person if production is to remain an option. Thus, the real and logical need for economics in production is carefully presented.Additionally, producers and students alike will find that application of careful economic planning results in long-term viability for individual producers as well as community projects, cooperatives, or even governmental projects. Special sections in the book illustrate the savings or costs of right and wrong decisions as well as those related to short versus longer term planning and investment. Other topics covered in this book include:
role of aquaculture in economic development
fish demand and supply
farm management and operation
time value of money in the short- and long-term
capital budgeting
market structure and price theory
government in aquacultureAlong with students, other readers will find the business help they need in Economics of Aquaculture. Professional aquaculturalists will find the topics of basic production economics, marketing, and cost analysis particularly relevant and governmental administrators will find the presentation of basic principles, time value of money, capital budgeting, and the role of government in aquaculture a valuable resource for years to come.
Trusted by 375,005 students
Access to over 1.5 million titles for a fair monthly price.
Fish accounts for nearly one quarter of the world’s supply of animal protein, and in many developing countries it is the ideal and traditional supplement to a basic diet of starches (James, 1986). Fish has been described as the “meat” of the “Third World.” Important contributions by the fisheries sector to both developing and developed economies are in the form of employment, income, and exchange earnings.
Growth in fish production increased from an annual catch of less than 20 million metric (20.32 million U.S.) tons in the late 1940s to exceed 65 million metric (71.6 million U.S.) tons by 1970. In the 1980s, about 80 to 90 million metric (81.28 to 91.44 million U.S.) tons of fish were produced (caught or cultured) worldwide annually (Rabanal, 1987; James, 1986). In 1987, world commercial fishery landings were about 93 million metric (94.48 million U.S.) tons. During the 1980s, landings increased consistently and by 1987 they were 29 percent above those of 1980. The former Soviet Block of nations combined and China have the largest landings, accounting for slightly over one-third of the world’s commercial catch. The United States had the fourth largest catch in 1987 (USDA, 1989).
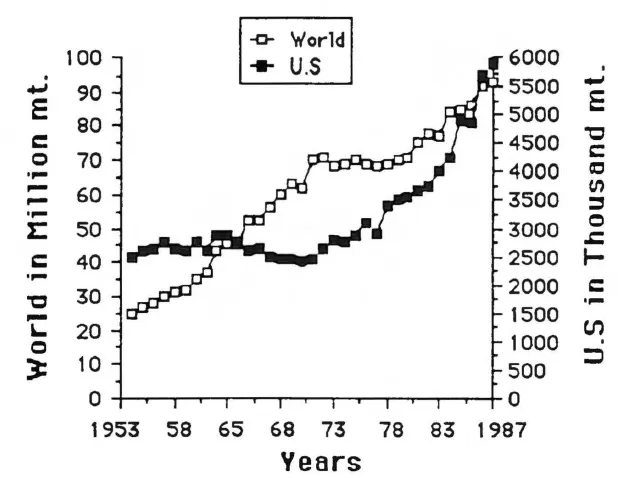
Underlying this expansion is the growth in the world economy, which was stimulated by two revolutionary technological developments. One was the introduction of synthetic fiber fishing nets and mechanical-gear hauling systems, which facilitated the use of large purse seines. The other was the introduction of freezing at sea, which allowed on-board processing and longer fishing trips (Bailey, 1987 and 1988). These innovations, along with the development of trawlnet fishing techniques, led to a dramatic increase in the size and the radius of fishing vessel operation. Figure 1-1 shows world and U.S. fish production from 1953 to 1987. The solid points represent U.S. production in thousand metric (1.016 thousand U.S.) tons, while the open points represent world production in million metric (1.016 million U.S.) tons. Over the 35-year period, the overall annual growth rate for world production was 4 percent, while for 8 years, growth in the U.S. was 2 percent. However, if growth rate is calculated for the period 1975-1987, world production growth is less than that of the U.S.
Source: The data were extracted from Aquaculture Situation and Outlook Report, USDA, September 1989. The world catch includes shellfish, but the data from U.S. include only finfish.
FIGURE 1-1. World and U.S. Fish Production (in metric tons), 1953-1987
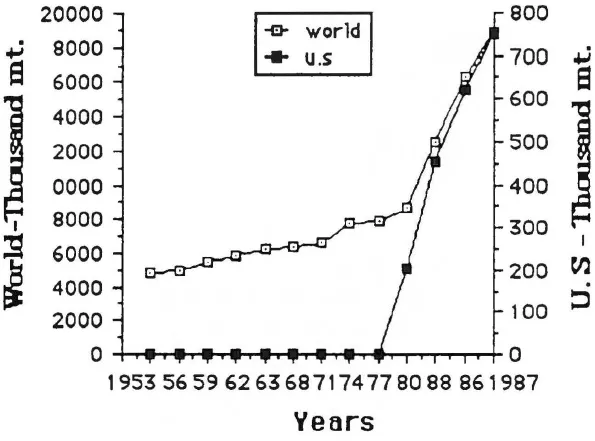
The majority of fish consumed by humans comes from capture fisheries. The problem is that natural supply is reaching a plateau, while consumption is increasing. Though production increased for 10 consecutive years, there has been a recent decrease in the rate of growth. The 1987 landings were only 0.6 percent above that of 1986. As the rate of increase of marine fish harvests dropped to less than 1 percent per year in recent years, aquacultural yields which now account for approximately 10 percent of total fish production increased at a rate of more than 7 percent per year (Rabanal, 1987; Kent, 1986). Since 1975, world aquacultural output has increased from 4.5 to over 10 million tons in 1987, yet less than one-tenth of the potential sea and land surface area is utilized. Figure 1-2 shows world and U.S. aquacultural production (Mitchison, 1986).
Definition: Aquaculture, which is commonly called fish farming, fish culture, or mariculture, is the rearing of fish, shellfish, and some aquatic plants, under controlled or semi-controlled conditions, for profit and/or human consumption. Freshwater aquaculture may include the farming of fin and shellfish, water chestnut, watercress, water-salad, bull frogs, prawns, crayfish, and other shellfish. Another form of aquaculture, mariculture, is the farming of sea fin and shellfish, such as flatfish, seabasses, mollusks, and shrimp, and the husbandry of marine organisms.
Techniques used in aquaculture may increase the production of fish and other aquatic foodstuffs far above the level that would be produced naturally. Aquaculture may be conducted in fresh water, brackish water, or seawater and also in flooded fields and rice paddies. The fish may be confined in earth ponds, concrete ponds, cages suspended in the open seas or lakes, or in impounded coastal waters. Confinement means the fish are protected from many natural predators but are more susceptible to disease and other problems.
GROWTH OF AQUACULTURE
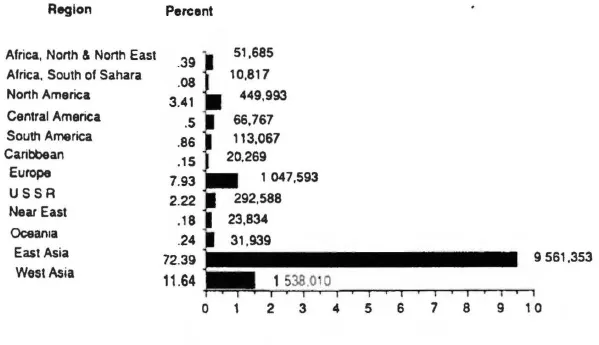
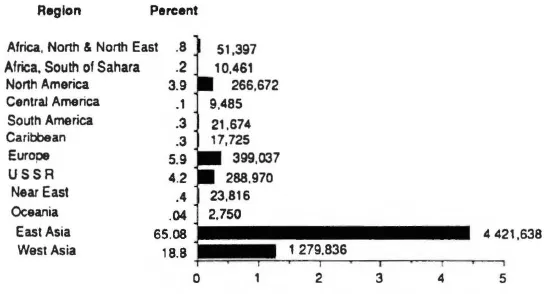
Fish culture began in 1000 B.C. in China and probably even earlier in Egypt and Assyria. The first known Chinese monograph on the subject of fish farming dates back to the fifth century B.C. Fish breeding was first found attractive by the Chinese. The selective breeding of ornamental goldfish was later introduced to Japan where ornamental carp breeding was perfected. The ancient Romans, who kept fish for food and entertainment, were the first known marine aquaculturists. They constructed ponds that were supplied with fresh seawater from the ocean. By about 1400 A.D.,, brackish water fish farms had been established in Java, and the common carp, Cyprinus carpio, had reached Europe from Asia transforming fish culture there (Encyclopedia Britannica, 1988). About the same time, four other species of carp, including the grass carp, Ctenopharyngodon idellus, and the black carp, Mylopharyngodon piceus, joined the common carp in mixed culture ponds in China. The collection and compilation of statistics on world aquacultural production is limited. It is, however, estimated that world production will approach 16.5 million metric (16.76 million U.S.) tons by 1992. This growth is a direct result of increased financial investments in intensive aquacultural farming. China is the leading producer of finfish and other aquacultural products. In 1987 China was responsible for over 50 percent of all finfish cultured. Figure 1-3a and Figure 1-3b show 1987 world aquaculture production in metric tons. East Asia is the overall largest producer of aquacultural products.
Source: The data were taken from Aquaculture Situation and Outlook Report, USDA, September 1989; and FAO Fisheries Aquaculture Production (1984-1987) Circular 815 No. 1, 1989.
FIGURE 1-2. World and U.S. Aquacultural Production, 1953-1987
United States
Commercial warm water fish farming in the United States was begun in the 1920s and early 1930s by a few persons who raised minnows to supply the growing demand for baitfish for sport fishing. In the 1950s, producers mainly in the southern states, began raising a number of species such as catfish, buffalo, bass, and crappie as food fish. Today, the major component of U.S. aquaculture comes from the channel catfish industry. Figure 1-4 shows that the catfish industry is the largest contributor to the aquacultural industry.
Fish production in the U.S. more than tripled between 1975 and 1983, from 130 million pounds to over 400 million pounds. Catfish have shown the most rapid expansion in production. The principal edible aquaculture products (by weight) in the U.S. are catfish, crawfish, salmon, and trout. These four species account for more than 90 percent of the aquacultural products moving through commercial channels. Catfish culture in the United States accounted for 73,840 acres of water in 1982 and reached 1 million acres by 1990. Commercial and noncommercial production of catfish reached more than 388 million pounds in 1988, about 4 percent above 1987. The value of this production was estimated at $321 million for 1988.
FIGURE 1-3a. World Aquaculture Production 1987 (in metric tons)
Source: Production data were taken from Nash, C. E. and C. B. Kensler (1990), and “A Global Overview of Aquaculture Production in 1987,” World Aquaculture, 21(2): 104-112.
FIGURE 1-3b. World Finfish Aquaculture Production 1987 (in metric tons)
United States crawfish production in 1987 was about 105 million pounds, with a value estimated at $53 million dollars. Production levels for salmon and trout for 1987 were 80 and 59 million pounds, respectively. Total aquacultural production from all species in 1987 was approximately 746.9 million pounds. Though catfish constitutes 50 percent of all private production of fish, it is responsible for only 44 percent of the total fish value, as shown in Figure 1-4. Bait fish account for only 3 percent of total production, but for 9 percent of total value. Another species which contributes more in percentage of total value than its production is oysters.
Mississippi remains the largest producer of fish in the U.S., where the dominant species is catfish. Other major producers of catfish are Alabama, Arkansas, Louisiana, and Texas. Figures 1-5 and Figure 1-6 show the number and average size of commercial catfish operations by state. Alabama has the largest number of farmers engaged in catfish production, but most of the farmers produce on relatively small acreages of less than 50 acres. Mississippi is the leading state in terms of average size of operations. Arkansas is second in terms of average size of operation. In all other states, farmers produce on farms of less than 50 acres. In Alabama, 12,400 acres of water were devoted to catfish production in 1986, most of which was located in the west central area of the state. In 1989, there were about 14,275 acres – an increase of about 14.3 percent.
Africa
In Africa, various species of Oreochromis, loosely referred to as tilapias, have been cultured since 1943. The tilapias are known for rapid breeding in ponds, a wide feeding spectrum, and ease of culture. Therefore, they serve as a good food fish, especially under li...
Table of contents
Cover
Half Title
Title Page
Copyright Page
Dedication
About the Authors
Table of Contents
Foreword
Preface
Acknowledgments
Chapter 1: Introduction
Chapter 2: Economics of Aquaculture
Chapter 3: Demand and Supply of Fish
Chapter 4: Production
Chapter 5: Cost of Production
Chapter 6: Factor-Factor and Product-Product Relationships
Chapter 7: Farm Management
Chapter 8: The Time Value of Money
Chapter 9: Capital Budgeting
Chapter 10: Market Structure and Theory of Price
Chapter 11: Marketing
Chapter 12: Government in Aquaculture
Appendix
Author Citations Index
Subject-Author Index
Frequently asked questions
Yes, you can cancel anytime from the Subscription tab in your account settings on the Perlego website. Your subscription will stay active until the end of your current billing period. Learn how to cancel your subscription
No, books cannot be downloaded as external files, such as PDFs, for use outside of Perlego. However, you can download books within the Perlego app for offline reading on mobile or tablet. Learn how to download books offline
Perlego offers two plans: Essential and Complete
Essential is ideal for learners and professionals who enjoy exploring a wide range of subjects. Access the Essential Library with 800,000+ trusted titles and best-sellers across business, personal growth, and the humanities. Includes unlimited reading time and Standard Read Aloud voice.
Complete: Perfect for advanced learners and researchers needing full, unrestricted access. Unlock 1.5M+ books across hundreds of subjects, including academic and specialized titles. The Complete Plan also includes advanced features like Premium Read Aloud and Research Assistant.
Both plans are available with monthly, semester, or annual billing cycles.
We are an online textbook subscription service, where you can get access to an entire online library for less than the price of a single book per month. With over 1.5 million books across 990+ topics, we’ve got you covered! Learn about our mission
Look out for the read-aloud symbol on your next book to see if you can listen to it. The read-aloud tool reads text aloud for you, highlighting the text as it is being read. You can pause it, speed it up and slow it down. Learn more about Read Aloud
Yes! You can use the Perlego app on both iOS and Android devices to read anytime, anywhere — even offline. Perfect for commutes or when you’re on the go. Please note we cannot support devices running on iOS 13 and Android 7 or earlier. Learn more about using the app
Yes, you can access Economics of Aquaculture by Curtis M Jolly,Howard A Clonts in PDF and/or ePUB format, as well as other popular books in Business & Agribusiness. We have over 1.5 million books available in our catalogue for you to explore.