eBook - ePub
Using Scanner Data for Food Policy Research
- 342 pages
- English
- ePUB (mobile friendly)
- Available on iOS & Android
eBook - ePub
Using Scanner Data for Food Policy Research
About this book
Using Scanner Data for Food Policy Research is a practitioners' guide to using and interpreting scanner data obtained from stores and households in policy research. It provides practical advice for using the data and interpreting their results. It helps the reader address key methodological issues such as aggregation, constructing price indices, and matching the data to nutrient values. It demonstrates some of the key econometric and statistical applications of the data, including estimating demand systems for policy simulation, analyzing effects of food access on food choices, and conducting cost-benefit analysis of food policies.
This guide is intended for early-career researchers, particularly those working with scanner data in agricultural and food economics, nutrition, and public health contexts.
- Describe different types of scanner data, the types of information available in the data, and the vendors that offer these data
- Describe food-label data that can be appended to scanner data
- Identify key questions that researchers should consider when acquiring scanner and label data for food policy research
- Demonstrate how to use scanner data using tools from econometric and statistical analyses, including the limitations in interpreting results using the data
- Describe and resolve key methodological issues related to using the data to facilitate more rapid analyses
- Provide an overview of published literature as background for designing new studies
- Demonstrate key applications of the data for food policy research
Trusted by 375,005 students
Access to over 1.5 million titles for a fair monthly price.
Study more efficiently using our study tools.
Information
Topic
ÉconomieSubtopic
Théorie économique 1
What is scanner data and why is it useful for food policy research?
Abstract
Scanner data obtained from stores or household panels allow for much more detailed analyses of food purchase behavior than previously possible using aggregated data. The data are recorded at the scannable barcode level and can be linked to detailed information on characteristics of products, purchasers, and stores. The main commercial suppliers of store and household scanner data across the globe are Kantar, IRI, and Nielsen, but sometimes researchers obtain data directly from stores. The data are increasingly being used for a broad range of food policy research applications. When using the data, researchers should have an understanding of the data collection procedures used by the data vendors; the extent of coverage across geographies, stores, households, and products; and potential barriers or other practical considerations.
Keywords
Store scanner data; Household scanner data; Universal Product Code (UPC); Global Trade Item Number (GTIN®); Price Look Up (PLU) code; Kantar; IRI; Nielsen; SPINS; GS1®
Before scanner data became available for use, researchers conducting studies on food purchasing behavior and the effects of food policies relied primarily on highly aggregated data from government data sources (National Research Council (NRC), 2005; Nayga, 1992). The level of aggregation in prior data sources meant that it was generally not possible to tease out differences across forms or varieties of a product, types of stores, regions of the country, seasons of the year, and other factors. When store scanner data became available (either from individual stores or from scanner data companies that obtain data from stores and sell syndicated datasets), researchers were able to conduct analyses at a much more granular level across multiple dimensions than previously possible. With the availability of scanner data collected from household panels, researchers were able to analyze research questions that relied on having a record of purchases for a household over time that is tied to demographic information about the household (Box 1.1). The availability of scanner data also meant that new research methods and techniques had to be developed to handle extremely large datasets and to construct relevant variables for analyses.
When working with scanner data, it is important to understand that scanner data companies such as IRI, Kantar, and Nielsen collect the data for commercial purposes. When developing data collection processes, these companies’ primary intent is to conduct analyses and prepare reports for use by their customers, which are generally manufacturers and retailers of consumer packaged goods. Selling their data directly for use by researchers is a relatively small portion of their revenue and outside of their typical business models. The sample of stores and households is generally selected based on convenience rather than use of statistical sampling methods to ensure representativeness. However, the scanner data companies calculate survey weights or projection factors that researchers can use in analyzing the data or provide data that have already been weighted to represent a geographic area or country.a When conducting analyses for their own clients, the scanner data companies may integrate data from other proprietary sources to ensure alignment with manufacturer shipments data or other targets. However, these other weights or adjustments are not available to the research community. Given this situation, researchers need to have a clear understanding of the nature of the data they are using for an analysis and how it affects the analysis approach and interpretation of analysis results.
Although scanner data are available for purchase soon after they are generated, the cost of the most recent data often puts it out of reach for many researchers. Typically, the most recent data that food policy researchers are able to access is from the prior year, and often the data are from several years past. Although the age of the data may prohibit the ability to analyze events immediately after their occurrence, the data are valuable for numerous other applications related to food policy research.
1.1 Understanding barcodes—A necessary condition for working with scanner data
The ability to collect and use scanner data for analyses arose with the adoption of scannable product codes, or barcodes, that are now used globally on nearly all packaged food and other types of products in retail stores. Scannable barcodes represent a unique manufacturer, brand, product, flavor, and size of a product. The global term for scannable barcodes is Global Trade Item Number (GTIN®), and these barcodes are overseen by the not-for-profit information standards organization GS1 US® (GS1 US, 2018). In the United States, the consumer-level GTIN has 12 digits and is commonly referred to as a Universal Product Code (UPC). In other countries, the GTIN has 13 digits and is commonly referred to as European Article Numbering (EAN) System code, or EAN-13. Most packaged fruits and vegetables and other perishable items also have 12- or 13-digit scannable barcodes, but products that are sold as random weight, meaning that consumers select individual items and pay for them by weight, may be tracked using Price Look Up (PLU) codes or barcodes used only within the store. GTINs, UPCs, or EAN codes are different from stock-keeping units (SKUs) that retailers used to track inventory for internal operations, but they can be used like SKUs in a retailer's inventory database (Hudson, 2017; Box 1.2).
Scannable barcodes comprise a company prefix identifying the brand owner (e.g., manufacturer or retailer), a set of digits that identifies the specific product, and a check digit (Box 1.3). The prefix is the initial 6- to 10-digit code licensed to the brand owner by GS1. Brand owners assign the remaining digits of the code (called the item reference number) to each of its products. The last digit, called the check digit, is calculated from the preceding digits and used to ensure the barcode is entered correctly in the rare instances when a barcode is hand-keyed because of an unreadable bar code.b For private-label (or store-brand) products, the prefix is typically associated with the retailer, although a contract manufacturer may manufacture the product. Because the brand owner assigns the portion of the barcode that identifies the specific product, there is no central database that can be used to identify products by barcode except for the scanner data described in this bookc.
Box 1.3
An example of a scannable barcode
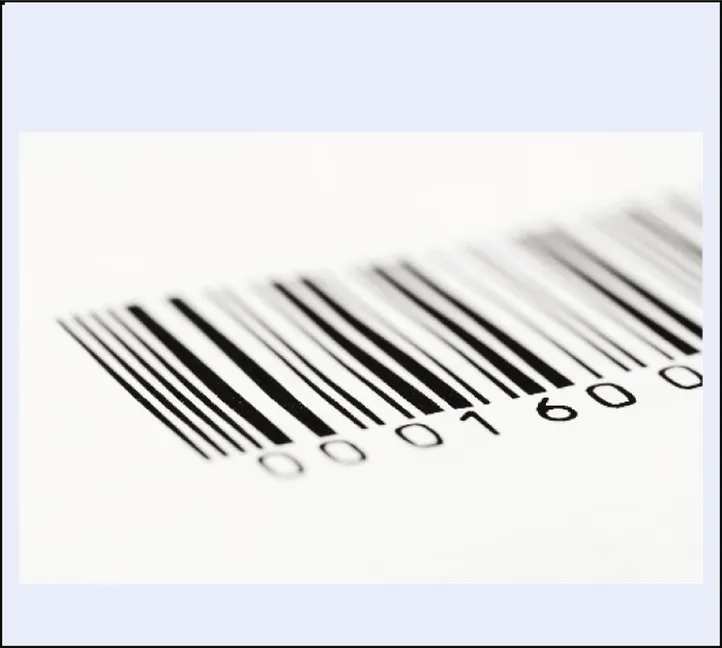
Note: Used with permission from GS1.
In scanner data, the barcode is accompanied by a product description field that includes the brand name and a unique abbreviated format of the product name, form or variety, and package size. GS1 provides guidance to manufacturers regarding when to assign a new barcode to a modified product, such as changes in declared formulation or functionality, changes in declared net content, gross weight changes of more than 20%, and addition or removal of a certification mark (GS1 US, n.d.; Fernandez, 2018). Thus, if the characteristics of a product change substantially, a manufacturer might assign a new barcode to a product (Martinez & Levin, 2017). However, the ultimate decision is at the manufacturer's discretion. In cases in which the manufacturer retains the barcode for a modified product, a data vendor might assign a generation code to the barcode to track the change (Muth et al., 2016). Although GS1 strongly discourages the practice, manufacturers might also reuse a barcode for substantially different products; thus, researchers might need to verify that a product is the same across years of data by comparing the product descriptions.
In contrast to barcodes that are used for packaged products, PLUs are used for random-weight products and other items in retail stores (Box 1.4). For most types of products, retailers determine the PLUs for use on their products. However, a set of universal 4- and 5-digit PLU codes has been developed for nonpackaged, random-weight fresh produce. Originally developed by a volunteer committee of the Produce Marketing Association in 1988, the PLU codes are now governed and maintained by the International Federation for Produce Standards (IFPS) (IFPS, 2017; Treacy, 2018). Nearly all random-weight produce in the United States, Canada, Australia, and New Zealand is sold using IFPS standard codes, and several other countries such as Chile and the Netherlands use them on most exported products (Treacy, 2018).
Table of contents
- Cover image
- Title page
- Table of Contents
- Copyright
- About the authors
- Preface and acknowledgments
- 1: What is scanner data and why is it useful for food policy research?
- 2: Sources of scanner data across the globe
- 3: Label and nutrition data at the barcode level
- 4: Methodological approaches for using scanner data
- 5: Insights from past food research using scanner data
- 6: Estimating food demand systems using scanner data
- 7: Measuring the food environment using scanner data
- 8: Conducting cost-benefit analyses using scanner and label data
- Index
Frequently asked questions
Yes, you can cancel anytime from the Subscription tab in your account settings on the Perlego website. Your subscription will stay active until the end of your current billing period. Learn how to cancel your subscription
No, books cannot be downloaded as external files, such as PDFs, for use outside of Perlego. However, you can download books within the Perlego app for offline reading on mobile or tablet. Learn how to download books offline
Perlego offers two plans: Essential and Complete
- Essential is ideal for learners and professionals who enjoy exploring a wide range of subjects. Access the Essential Library with 800,000+ trusted titles and best-sellers across business, personal growth, and the humanities. Includes unlimited reading time and Standard Read Aloud voice.
- Complete: Perfect for advanced learners and researchers needing full, unrestricted access. Unlock 1.5M+ books across hundreds of subjects, including academic and specialized titles. The Complete Plan also includes advanced features like Premium Read Aloud and Research Assistant.
We are an online textbook subscription service, where you can get access to an entire online library for less than the price of a single book per month. With over 1.5 million books across 990+ topics, we’ve got you covered! Learn about our mission
Look out for the read-aloud symbol on your next book to see if you can listen to it. The read-aloud tool reads text aloud for you, highlighting the text as it is being read. You can pause it, speed it up and slow it down. Learn more about Read Aloud
Yes! You can use the Perlego app on both iOS and Android devices to read anytime, anywhere — even offline. Perfect for commutes or when you’re on the go.
Please note we cannot support devices running on iOS 13 and Android 7 or earlier. Learn more about using the app
Please note we cannot support devices running on iOS 13 and Android 7 or earlier. Learn more about using the app
Yes, you can access Using Scanner Data for Food Policy Research by Mary K. Muth,Abigail Okrent,Chen Zhen,Shawn Karns in PDF and/or ePUB format, as well as other popular books in Économie & Théorie économique. We have over 1.5 million books available in our catalogue for you to explore.