- 478 pages
- English
- ePUB (mobile friendly)
- Available on iOS & Android
eBook - ePub
About this book
Flood Forecasting: A Global Perspective describes flood forecast systems and operations as they currently exist at national and regional centers around the globe, focusing on the technical aspects of flood forecast systems. This book includes the details of data flow, what data is used, quality control, the hydrologic and hydraulic models used, and the unique problems of each country or system, such as glacial dam failures, ice jams, sparse data, and ephemeral streams and rivers. Each chapter describes the system, including details about its strengths and weaknesses, and covers lessons learned. This helpful resource facilitates sharing knowledge that will lead to improvements of existing systems and provides a valuable reference to those wishing to develop new forecast systems by drawing on best practices.
- Covers global systems allowing readers to see a worldwide perspective with different approaches used by existing flood forecast systems
- Provides historical coverage allowing readers to understand why forecast systems have developed as they have and to see how specific systems have dealt with common problems encountered
- Presents a vision of what appears to be the future of hydrologic forecasting and difficulties facing hydrologic forecasting
- Provides a helpful resource to facilitate improvements to existing systems based on a best practices approach
Trusted by 375,005 students
Access to over 1.5 million titles for a fair monthly price.
Study more efficiently using our study tools.
Information
Subtopic
Global Warming & Climate ChangePart 1
National and Regional Flood Forecasting Systems
Chapter 1
Australian Bureau of Meteorology Flood Forecasting and Warning
T.C. Pagano*; J.F. Elliott†; B.G. Anderson*; J.K. Perkins‡ * Australian Bureau of Meteorology, Melbourne, Australia
† Australian Bureau of Meteorology, Melbourne, Australia (Retired)
‡ Australian Bureau of Meteorology, Brisbane, QLD, Australia
† Australian Bureau of Meteorology, Melbourne, Australia (Retired)
‡ Australian Bureau of Meteorology, Brisbane, QLD, Australia
Abstract
The Bureau of Meteorology (Bureau) has a long history of providing effective flood warnings to diverse communities in Australia, ranging from major metropolitan centers to remote communities with limited communication access. In addition to statistical models relating upstream peak river heights to downstream river heights, the main rainfall-runoff modeling tool for hydrologists is the event-based Unified River Basin Simulator (URBS) model. With the recent adoption of Deltares’ Flood Early Warning System as a forecasting environment, hydrologists now have increased ability to directly ingest numerical weather prediction model rainfall forecasts. The main public products of the system are text flood warnings and watches based on predetermined flood class levels (eg, minor, moderate, and major flood). Australia’s extreme variability in population density affects critical inputs to flood forecasting, such as the density of gauging stations, as well as the demand for services. The variable demand for services has led Australia to adopt a mix of regional and national forecasting centers. During periods of high activity in any given region, hydrologists from a “flying squad” can provide fly-in or remote support to regional forecasters.
Keywords
Australia; Flood forecasting; HyFS; Warning systems; Prediction; Operational forecasting; Rivers; Floods
Acknowledgments
Thanks are given to Soori Sooriyakumaran and Dasarath Jayasuriya for their reviews of this chapter. We are also appreciative of Tanya Smith’s editorial improvements.
1 Introduction
Flood warning is one of the key measures used to mitigate the damaging impact of floods in Australia. Viewed as a total system, flood warning involves agencies at all levels of government working in partnership, with the Bureau playing a lead role as the national flood forecasting agency. In this chapter, the nature of the flood problem in Australia is briefly described in terms of the key demographic and climate influences, followed by a history of the development of flood forecasting in Australia. The organization of flood forecasting within the Bureau and the nature of the Bureau’s role in the total flood warning system is provided, followed by a description of the current Bureau flood forecasting system and operations. This includes details of current hydrologic modeling tools and more recent developments, including the improved utilization of weather forecasting inputs. Finally, important operational challenges faced by flood forecasters are discussed, concluding with an outline of plans for the future direction of the service.
2 Demographics, Climate, and Floods of Australia
Australia is a very sparsely populated continent, with a national density of around three persons per square kilometer, the third lowest in the world. Around two thirds of the overall population of nearly 24 million1 live in the federal and state/territory capital cities (Figs. 1 and 2), almost all of which are close to coastlines. Overall population growth varies between 1% and 2% annually, although coastal populations are growing more rapidly, with the population of some regions of coastal Queensland increasing at 4.7% annually (Australian Bureau of Statistics, 2012).
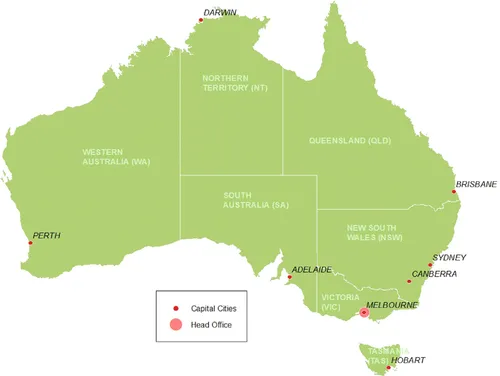
Fig. 1 Federal capital (Canberra) and capital cities of Australian states/territories (from Bureau of Meteorology, 2014). The Bureau of Meteorology has Regional Offices in every capital city and a Head Office in Melbourne.
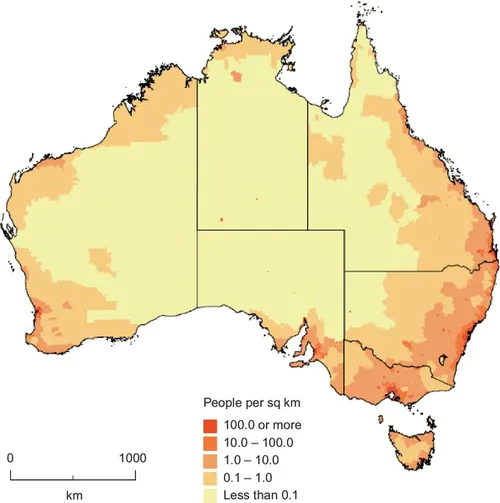
Fig. 2 Population density of Australia in Jun. 2010 (from Australian Bureau of Statistics, 2014). Note the relatively large areas of low population density. Regional population growth, Australia (3218.0).
In addition to the capital cities, there are significant population centers in the inland regional areas that were initially settled beside major rivers, as well as many smaller remote communities, including those of indigenous populations. An important contribution to population growth has been immigration. Australia is a multicultural country and for many residents, English is a second language. This is an important factor in emergency management planning, especially in the design of warning information.
Australia is the driest inhabited continent, with extreme variability in both annual rainfall (Fig. 3) and streamflow.2 It features a wide range of climatic zones, from the tropical regions of the north, through the arid expanses of the interior, to the temperate regions of the south. Elevation also has an influence on rainfall, with the Great Dividing Range, the Australian Alps, and western Tasmania receiving higher rainfall totals.
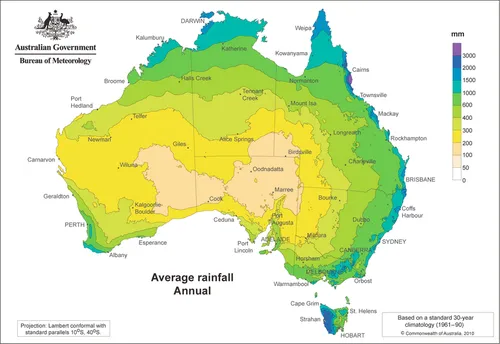
Fig. 3 Annual precipitation of Australia 1961–90. Bureau of Meteorology. (2000). Climatic atlas of Australia — Rainfall (p. 25). Melbourne, VIC: Bureau of Meteorology.
There can be large seasonal fluctuations in both rainfall and temperature in parts of the country. In northern Australia, temperatures are warm throughout the year, with a wet season from approximately Nov. through Apr. — when almost all the rainfall occurs — and a dry season from May to Oct. Further south, temperature is more important in defining seasonal differences and rainfall is more evenly distributed throughout the year, reaching a marked winter peak in the south-west and along parts of the southern fringe.
The major driver of interannual climate variability, particularly in eastern Australia, is the El Niño-Southern Oscillation (ENSO) phenomenon. El Niño is an anomalous warming of the central and eastern tropical Pacific Ocean, while La Niña, the reverse phase of the system, is an anomalous cooling. The Southern Oscillation is the atmospheric counterpart to El Niño’s oceanic changes. El Niño events are generally associated with a reduction in winter and spring rainfall across much of eastern, northern, and southern Australia. This can lead to widespread and severe drought, particularly in eastern Australia. Conversely, La Niña events are generally associated with wetter-than-normal conditions and have contributed to many of Australia’s most notable floods (eg, 2010-12 in the eastern half of the country).
Tropical cyclones bring heavy rain as well as strong winds and are the cause of most of Australia’s highest-recorded daily rainfalls. Although tropical cyclones rapidly lose their intensity on moving over land, rainfall associated with former cyclones often persists well after the destructive winds have eased and can occasionally bring heavy rains deep into the inland, causing widespread flooding. Parts of inland Western Australia receive 30–40% of their average annual rainfall from these tropical depressions, with certain places receiving their average annual rainfall within a 1- or 2-day period as a tropical cyclone (or ex-cyclone) passes by. Intense low pressure systems can also form outside the tropics, most commonly off the east coast, where they are known as “east coast lows.” These systems can bring very strong winds and heavy rain, particularly where they direct moist easterly winds on their southern flank onto the coastal ranges of southern Queensland, New South Wales, eastern Victoria, and northeastern Tasmania.
Floods in Australia (Fig. 4) are predominantly caused by heavy rainfall, although extreme tides, storm surge, tsunami, snow melt, levee failure, groundwater surcharge, or dam break can also cause flooding (Middlemann, 2007). More recently, coastal flooding as a result of sea level rise precipitated by climate change is increasingly incorporated in planning and land management strategies.
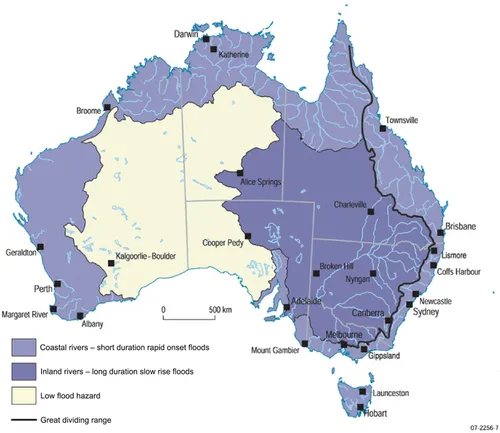
Fig. 4 Australian flood hazard map. From Geoscience, A. (2015). Flood potential in Australia map. http://www.ga.gov.au/metadata-gateway/metadata/record/69538/.
Floods as a result of heavy rainfall can be broadly categorized as either flash floods or riverine floods. Flash f...
Table of contents
- Cover image
- Title page
- Table of Contents
- Copyright
- Dedication
- Contributors
- Foreword
- Acknowledgments
- Flood Forecasting: A Global Perspective
- Part 1: National and Regional Flood Forecasting Systems
- Part 2: Continental Modeling and Monitoring — The Future?
- Part 3: Challenges Facing Flood Forecasting
- Index
Frequently asked questions
Yes, you can cancel anytime from the Subscription tab in your account settings on the Perlego website. Your subscription will stay active until the end of your current billing period. Learn how to cancel your subscription
No, books cannot be downloaded as external files, such as PDFs, for use outside of Perlego. However, you can download books within the Perlego app for offline reading on mobile or tablet. Learn how to download books offline
Perlego offers two plans: Essential and Complete
- Essential is ideal for learners and professionals who enjoy exploring a wide range of subjects. Access the Essential Library with 800,000+ trusted titles and best-sellers across business, personal growth, and the humanities. Includes unlimited reading time and Standard Read Aloud voice.
- Complete: Perfect for advanced learners and researchers needing full, unrestricted access. Unlock 1.5M+ books across hundreds of subjects, including academic and specialized titles. The Complete Plan also includes advanced features like Premium Read Aloud and Research Assistant.
We are an online textbook subscription service, where you can get access to an entire online library for less than the price of a single book per month. With over 1.5 million books across 990+ topics, we’ve got you covered! Learn about our mission
Look out for the read-aloud symbol on your next book to see if you can listen to it. The read-aloud tool reads text aloud for you, highlighting the text as it is being read. You can pause it, speed it up and slow it down. Learn more about Read Aloud
Yes! You can use the Perlego app on both iOS and Android devices to read anytime, anywhere — even offline. Perfect for commutes or when you’re on the go.
Please note we cannot support devices running on iOS 13 and Android 7 or earlier. Learn more about using the app
Please note we cannot support devices running on iOS 13 and Android 7 or earlier. Learn more about using the app
Yes, you can access Flood Forecasting by Thomas E. Adams,Thomas C. Pagano in PDF and/or ePUB format. We have over 1.5 million books available in our catalogue for you to explore.