
eBook - ePub
Introduction to Diffusion Tensor Imaging
And Higher Order Models
- 140 pages
- English
- ePUB (mobile friendly)
- Available on iOS & Android
eBook - ePub
About this book
The concepts behind diffusion tensor imaging (DTI) are commonly difficult to grasp, even for magnetic resonance physicists. To make matters worse, a many more complex higher-order methods have been proposed over the last few years to overcome the now well-known deficiencies of DTI. In Introduction to Diffusion Tensor Imaging: And Higher Order Models, these concepts are explained through extensive use of illustrations rather than equations to help readers gain a more intuitive understanding of the inner workings of these techniques. Emphasis is placed on the interpretation of DTI images and tractography results, the design of experiments, and the types of application studies that can be undertaken. Diffusion MRI is a very active field of research, and theories and techniques are constantly evolving. To make sense of this constantly shifting landscape, there is a need for a textbook that explains the concepts behind how these techniques work in a way that is easy and intuitive to understand—Introduction to Diffusion Tensor Imaging fills this gap.
- Extensive use of illustrations to explain the concepts of diffusion tensor imaging and related methods
- Easy to understand, even without a background in physics
- Includes sections on image interpretation, experimental design, and applications
- Up-to-date information on more recent higher-order models, which are increasingly being used for clinical applications
Trusted by 375,005 students
Access to over 1.5 million titles for a fair monthly price.
Study more efficiently using our study tools.
Information
Chapter 1
Basics of Diffusion Measurement
1.1 NMR Spectroscopy and MRI Can Detect Signals from Water Molecules
Nuclear magnetic resonance (NMR) spectroscopy and magnetic resonance imaging (MRI) can be used to observe signals from various nuclei, but this book focuses only on the proton (1H) of water molecules (H2O) as the nucleus of interest. This is because more than 90% of protons in the body are located in water molecules, and the MRI signal is therefore dominated by water.
When we perform NMR spectroscopy, we put our sample (in this case, water) in a tube and place it inside a magnet. We then input energy into the sample (a process called excitation) and observe the signal emitting from the sample. This is similar to ringing a bell and listening to the sound. There are only three types of information in the signal: frequency (i.e., high or low pitch), intensity (i.e., loudness), and phase. To visualize this information, we use a waveform diagram such as that shown in Fig. 1.1. These waves are often called time-domain data because the horizontal axis is the time elapsed while we are listening to the signal. After Fourier transform, the time axis transforms to the so-called frequency domain, in which the horizontal axis is frequency. Figure 1.1 shows a simple relationship between the time domain wave properties and frequency domain peak properties.
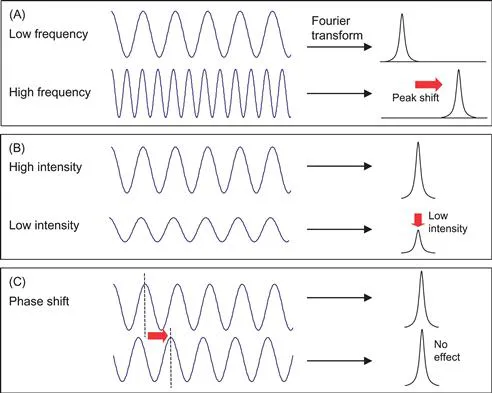
Figure 1.1 Diagram showing frequency, intensity, and phase of waves. After Fourier transform, the waves in the time axis are transformed into peaks in the frequency axis. When we use so-called magnitude calculation, phase difference makes no impact on the peaks in the frequency domain.
These three types of wave properties carry much information about the material; in our example of the bell, we can tell the size of the bell and its wall thickness. The signal that comes from the NMR sample after excitation is not sound but magnetic field oscillation. However, the situation is the same in that the only information we get is the three properties of oscillating signal, and they carry information about the sample properties. For example, if we put ethanol in the tube, we get a different frequency from that of water. From the frequency, we can tell much about what is in the tube. The intensity is proportional to the concentration of the sample. Unless we carry out advanced NMR spectroscopy or flow/velocity measurements, we do not use phase information. For us, the situation is very simple. We know that the sample is water, so we expect only one frequency which corresponds to that of water molecules. The concentration of water is 100%, so we should get a very intense signal.
The situation is also simple for MRI (Fig. 1.2). Here again, we have only intensity information. Because we are observing the water signal, we can assume that we have only one frequency. Phase information is usually discarded in MRI. When there is no water within a pixel, that pixel has no intensity. When there is a small amount of water like skin, it looks faint. The brain is full of water and thus looks very intense. Basically, it tells us where water is and what its concentration is (called proton density).

Figure 1.2 An example of MR image (proton density). Yellow, blue, and red arrows represent regions with no, low, and high water concentrations, respectively.
The question now is: how can we measure the diffusion constant of water molecules using NMR spectroscopy or MRI? We must somehow relate signal intensity information to the water diffusion process. Obviously we cannot measure it from just one spectrum or image because, as mentioned earlier, the only information we have is signal intensity, which is mostly related to proton density (but not to the property of water diffusion). Before we begin a discussion of how to measure diffusion, it is important to first consider what “diffusion” is.
1.2 What is Diffusion?
We are interested in the motion of water molecules, and there are several ways in which they can move. For example, when we are imaging a human subject, he or she may move during the scan. This is the bulk movement of all water molecules in the body (Fig. 1.3A). Let us define bulk motion as the movement of water molecules by more than a pixel. If our image resolution is 2 mm and the subject (and the water inside) moves more than 2 mm, this is bulk motion. There are two types of effects on images: if the motion occurs during imaging, the image would be corrupted (blurring and ghosting). If we are acquiring multiple images, images before and after the motion would not be coregistered. We can therefore detect bulk motion by MRI, but, of course, this is not what we are interested in.
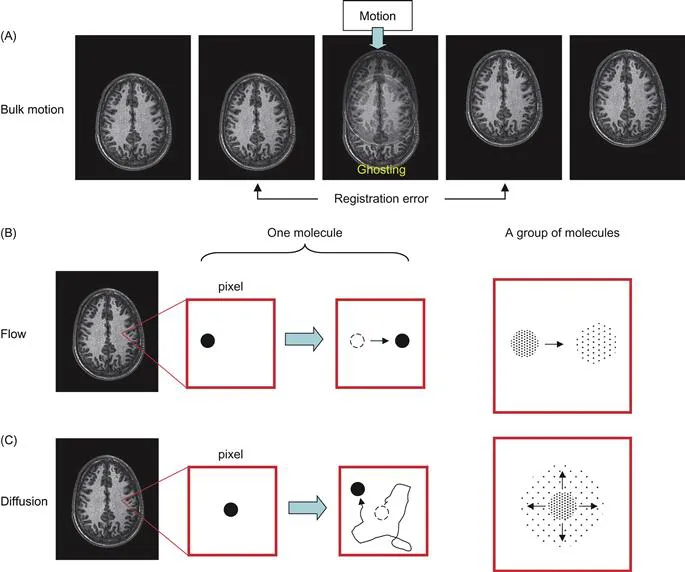
Figure 1.3 Difference between bulk motion (A), flow (B), and diffusion (C).The actual amount of water diffusion is approximately 5–10 µm during MR measurements, while the pixel size is typically 2–5 mm. So, the water motion in (C) is exaggerated.
The second kind of water motion is flow (Fig. 1.3B), which is a one-directional water motion. If the amount of movement is larger than the pixel size (e.g., 2 mm), it can be treated as bulk motion. The term “flow” in this book specifically means one-directional water motion within a pixel. If we drop ink within a pixel (assuming that we can do such a thing), the ink stays in the pixel and the center of the ink moves. This flow has a distinctive effect on an MR signal. As will be explained later, it shifts the phase of the signal. Therefore, in principle, we can measure flow by NMR/MRI. However, as mentioned earlier, we usually discard phase information. So we can say that small flow motion within a pixel can be ignored. In practical situations, things can be more complicated because of large blood flow or non-unidirectional flow due to convoluted capillary structure. We usually ignore this because the population of water within blood vessels of the brain is small (about 5%) compared to those in the parenchyma. Also, when there is a tiny amount of bulk motion such as brain pulsation, it shifts the locations of water molecules on a subpixel scale. This also causes significant signal phase shift, which may interfere with our MRI measurements. This point will be described in more depth in Chapter 6.
The third kind of motion, and the one we are interested in, is “diffusion” (Fig. 1.3C). This is also called intra-voxel incoherent motion (IVIM), random motion, or Brownian motion. This motion has nothing to do with physiological motion; even water molecules in a test tube will move around unless the sample is frozen. If we drop ink in such a system, its shape becomes bigger as time elapses but its center remains at the same position. Along any arbitrary axis, the probability of going one way or the other is the same. The ink will spread out according to a “Gaussian distribution” (assuming there is no barrier), and this is what we want to measure.
1.3 How to Measure Diffusion?
1.3.1 We Need Gradient Systems to Measure the Diffusion Constant
In the previous section, we defined what diffusion is. We also learned that the only information we usually use for NMR/MRI is signal intensity; peak height in NMR spectroscopy or pixel intensity in MRI. The intensity is dominated by water concentration (proton density). It is also influenced by signal relaxation time such as T1 and T2. Here, our task is to sensitize the signal intensity to the amount of water diffusion or diffusion constant. For this purpose, we need to use a special device called a “pulsed magnetic field gradient” (referred to hereafter as simply “gradient”).
The magnetic field gradient is a technology that introduces a linear magnetic field inhomogeneity (i.e., gradient) (Fig. 1.4).
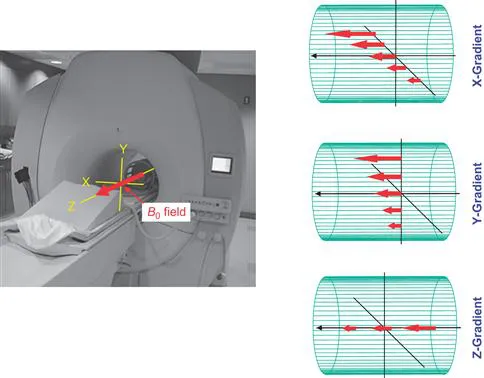
Figure 1.4 The main magnetic field, B0, and orientations of X, Y, and Z field gradient. The B0 field, shown by the red arrows, lies along the magnet bore (z axis).The gradient units modulate the strength of the B0 field linearly along one of the three axes.
In the magnet, the magnetic field, called the B0 field, is pointing along the magnet bore, which is defined as the z axis. The x and y axes are the right–left and up–down ...
Table of contents
- Cover image
- Title page
- Table of Contents
- Copyright
- Preface
- Acknowledgments
- Chapter 1. Basics of Diffusion Measurement
- Chapter 2. Anatomy of Diffusion Measurement
- Chapter 3. Mathematics of Diffusion Measurement
- Chapter 4. Principle of Diffusion Tensor Imaging
- Chapter 5. Mathematics of Diffusion Tensor Imaging
- Chapter 6. Practical Aspects of Diffusion Tensor Imaging
- Chapter 7. New Image Contrasts from Diffusion Tensor Imaging: Theory, Meaning, and Usefulness of DTI-Based Image Contrast
- Chapter 8. Moving Beyond DTI: High Angular Resolution Diffusion Imaging (HARDI)
- Chapter 9. Fiber-Tracking: 3-Dimensional Tract Reconstruction
- Chapter 10. Quantification Approaches
- Chapter 11. Application Studies
- Index
Frequently asked questions
Yes, you can cancel anytime from the Subscription tab in your account settings on the Perlego website. Your subscription will stay active until the end of your current billing period. Learn how to cancel your subscription
No, books cannot be downloaded as external files, such as PDFs, for use outside of Perlego. However, you can download books within the Perlego app for offline reading on mobile or tablet. Learn how to download books offline
Perlego offers two plans: Essential and Complete
- Essential is ideal for learners and professionals who enjoy exploring a wide range of subjects. Access the Essential Library with 800,000+ trusted titles and best-sellers across business, personal growth, and the humanities. Includes unlimited reading time and Standard Read Aloud voice.
- Complete: Perfect for advanced learners and researchers needing full, unrestricted access. Unlock 1.5M+ books across hundreds of subjects, including academic and specialized titles. The Complete Plan also includes advanced features like Premium Read Aloud and Research Assistant.
We are an online textbook subscription service, where you can get access to an entire online library for less than the price of a single book per month. With over 1.5 million books across 990+ topics, we’ve got you covered! Learn about our mission
Look out for the read-aloud symbol on your next book to see if you can listen to it. The read-aloud tool reads text aloud for you, highlighting the text as it is being read. You can pause it, speed it up and slow it down. Learn more about Read Aloud
Yes! You can use the Perlego app on both iOS and Android devices to read anytime, anywhere — even offline. Perfect for commutes or when you’re on the go.
Please note we cannot support devices running on iOS 13 and Android 7 or earlier. Learn more about using the app
Please note we cannot support devices running on iOS 13 and Android 7 or earlier. Learn more about using the app
Yes, you can access Introduction to Diffusion Tensor Imaging by Susumu Mori,J-Donald Tournier in PDF and/or ePUB format, as well as other popular books in Medicine & Neurology. We have over 1.5 million books available in our catalogue for you to explore.