eBook - ePub
READy: Renewable Energy Action on Deployment
policies for accelerated deployment of renewable energy
- 280 pages
- English
- ePUB (mobile friendly)
- Available on iOS & Android
eBook - ePub
READy: Renewable Energy Action on Deployment
policies for accelerated deployment of renewable energy
About this book
Are you developing strategies for a future sustainable energy supply? Are you designing policies to deploy renewable energy technologies in your country? Are you looking for new tools and measures to make your policies more effective? Are you planning to make decisions on renewable energy investments in certain countries and are you checking their policy robustness?
Let the IEA guide you into successful, efficient and effective policies and decisions for accelerating deployment of renewable energy. Learn about the six policy actions that are essential ingredients for your policy portfolio:
- Alliance Building
- Communicating
- Target Setting
- Integration in economic policies
- Optimizing existing instruments and
- Neutralizing disadvantages on the playing field
This book shows why and how successful renewable energy strategies work. Many recent and actual examples of best cases and experiences in policies--based on literature and interviews--show how policies can best mobilize national and international renewable energy business and the financial institutions, while creating broad support. The book is an initiative of the IEA-RETD, an international agreement between nine countries to investigate and accelerate the deployment of renewable energy deployment.
- Presents you with a variety of policy options that have been proven to accelerate the deployment of renewable energy technologies
- Based on experiences around the world at the local, regional and national levels
- Includes the IEA's ACTION star, a decision-making tool for developing a consolidated renewables policy framework
- Find inspiration in this guide's depiction of the significant renewable energy developments to date and the many examples of successful policies featured
Trusted by 375,005 students
Access to over 1.5 million titles for a fair monthly price.
Study more efficiently using our study tools.
Information
Part One
Trends and Outlooks
Chapter One Global and Regional Trends in Renewable Energy
Chapter Two What Is Possible and by When?
Chapter Three Drivers and Barriers
Chapter One
Global and Regional Trends in Renewable Energy
Contents
1.1. Renewable Energy Markets
1.2. Electricity Market Trends: Rapid Growth
1.3. Transportation Market Trends: A Mixed Picture
1.4. Heating/Cooling Market Trends: Slow Awakening of the “Sleeping Giant”
1.5. Investments Increasing at all Development Stages
1.6. Cost Trends and Future Prospects
1.7. Policy Trends
1.8. International Players
1.9. Near-Term Market Outlook
1.10. Global Wind Market Projections
1.11. Global Solar PV Market Projections
1.12. To Get Ready for the Next Step
Renewable energy is clearly entering the mainstream. In 2010, an estimated 16.7% of global final energy was supplied by renewable energy—including hydropower, wind, solar, geothermal, and traditional and modern biomass energy. Modern renewable energy provided about 8.2% of this total, with traditional biomass accounting for an estimated 8.5% according to the REN21 Renewables 2012 Global Status Report. Further, renewables accounted for almost half of new electric capacity added worldwide during 2011, and generate about 20.3% of global electricity based on generating capacity in operation at year’s end. Market growth has been rapid in recent years, with an accelerated growth rate for some technologies over the past half-decade. The global economic crises of 2009 and 2011 slowed growth in some technologies and regions, but overall growth has continued.
Renewable energy markets have continued their rapid growth in recent years, both in total scale and in geographic distribution, in spite of the global economic recession. Global investment in renewable power and fuels, at all stages of development, has also risen rapidly and was up more than sixfold between 2004 and 2011. In response to technology advances and greater economies of scale, renewable energy costs have fallen dramatically and further cost reductions are expected in all technologies. All of these developments are due greatly to a significant increase in government support policies for renewable energy and a growing number and expanding breadth of international players involved with renewable energy.
This chapter reviews the major trends in renewable energy development over the past two decades, with emphasis on the past five years. It begins with an overview of market trends by the end-use sector and technology, followed by developments in renewable energy investment in recent years, and past cost trends and future expected reductions. Trends related to government policies focused specifically on renewable energy are covered next, followed by a brief discussion of relevant international players in the renewable energy arena, ranging from international organizations to international finance organizations to nongovernmental organizations (NGOs) and the private sector. The final section provides an overview of various projections for future market development and renewable energy deployment.
Except where otherwise noted, data and trends in this chapter are drawn primarily from the Renewables 2012 Global Status Report of REN21 (Renewable Energy Policy Network for the 21st Century); the investment data are from Bloomberg New Energy Finance (BNEF) and drawn from Global Trends in Renewable Energy Investment 2012 (UN Environment Programme, Frankfurt School, and BNEF).
1.1 Renewable Energy Markets
Renewable energy markets have grown rapidly over the past several years, particularly in the electricity sector, where solar photovoltaics (PV) has witnessed rapid expansion and has remained the world’s fastest growing energy technology for some time. Figure 1.1 shows growth rates of several renewable technologies for the year 2011, and annual averages for the five year period from the end of 2006 through 2011. Many technologies experienced remarkable growth, with solar PV and solar hot water/heating seeing even higher rates of growth during 2011 than the average over the 2006–2011 period.
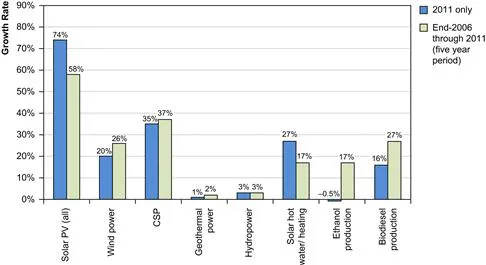
FIGURE 1.1 Average Annual Growth Rates of Renewable Energy Capacity and Biofuels Production, 2006–2011
(From REN21, Renewables 2012 Global Status Report). For color version of this figure, the reader is referred to the online version of this book.
After PV, concentrating solar thermal power (CSP) has witnessed the most rapid relative growth in the electricity sector over the past five years, growing from a small base, and wind power capacity has also grown rapidly. In terms of total new capacity added during this period, wind power takes the lead with about 164 GW, followed by hydropower. As seen in Figure 1.1, biofuel production and consumption took off in the middle of the last decade, but growth rates have since slowed, with ethanol production remaining stable or declining slightly in 2011. The renewables heat sector is considered by many to be a sleeping giant, with enormous potential that is still waiting to be tapped, although markets have begun to pick up in recent years. Table 1.1 shows the changes in cumulative capacity or annual production that various renewables witnessed between 2006 and 2011.
In 2011, renewable energy accounted for almost half of the electric capacity added worldwide.
TABLE 1.1 Global renewable energy installed capacity or annual production, 2006 and 2011
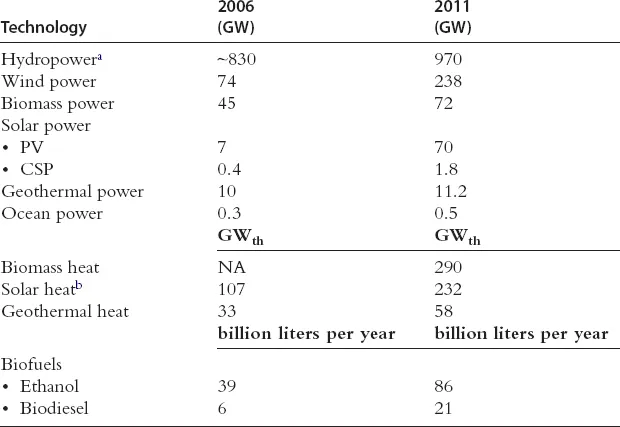
Source: Data rounded and sourced from REN21, Renewables Global Status Report, various years.
aHydropower data are estimated and do not include pure pumped storage.
bSolar heat data are estimated and do not include unglazed systems (for swimming pools).
1.2 Electricity Market Trends: Rapid Growth
In 2011, renewable energy accounted for almost half of the ~208 GW of electric capacity added worldwide. Renewables account for about a quarter of the world’s electric capacity (estimated to be 5360 GW at the end of 2011) and provide an estimated 20.3% of global electricity supply, based on total global generating capacity in place at the end of 2011.
Hydropower
Hydropower is used in more than 150 countries and generates most of this supply, accounting for an estimated 15.3% of global electricity production in 2011. Asia leads the world for total hydropower capacity, followed by Europe, North and South America, and finally Africa at a distant fifth. Asia and South America, led by China and Brazil, are the most active markets for new development, with several large dams under construction as well as many small-scale projects. New plants are also being constructed in North America and Europe, although the greatest focus is on modernization of existing plants and development of pumped storage to support high-capacity shares of variable renewable technologies.
Despite the large increases in hydropower capacity in recent years, as seen in Table 1.1, hydropower’s share of total global electricity production has declined (from 19% in the mid-1990s) as consumption has expanded at a faster pace. Further, hydropower’s share of total renewable capacity is falling as markets for other renewable technologies surge. In 2004, hydropower accounted for about 89% of total installed renewable electric capacity; by the end of 2011, its share had fallen to an estimated 71.3%.
Wind Power
After hydropower, wind power has experienced the largest capacity gains, rising rapidly from 74 GW in operation at the end of 2006 to nearly 238 GW at the end of 2011. An estimated 40 GW was added during 2011, increasing total global capacity by about 20% relative to year end 2010.
By the end of 2011, wind power capacity installed was enough to meet an estimated 2–3% of global electricity consumption; while still a small share, it was up significantly in a few short years. And wind power’s share of total demand was far higher in several individual countries—for example, nearly 26% in Denmark, 15.9% in Spain, 15.6% in Portugal, and 12% in Ireland—while wind power capacity installed in the European Union (EU) by the end of 2011 was enough to meet 6.3% of the region’s electricity use in a normal wind year (up from 5.3% in 2010). Shares are even higher in many states and provinces. For example, four German states met more than 46% of their electricity demand with wind in 2011; South Australia produces 20% of its electricity with wind; and five U.S. states met more than 10% of their electricity demand with wind in 2011.
Policy uncertainty and the continuing economic crisis have combined to slow the growth of wind power in developed countries, although the United States saw a jump in capacity additions in 2011 driven by the approaching expiration of some important federal incentives. For the second year in a row, the majority of new capacity was added in developing countries and emerging markets rather than in wind’s traditional markets. Leadership has shifted from Europe (initially Denmark, and more recently Germany and Spain) to the United States, and most recently to China, which accounted for half the global market in 2010 and an estimated 44% in 2011. In recent years, wind power has become one of the broadest-based renewable energy technologies, with commercial installations in more than 70 countries by 2006, and in 83 countries by 2010; at least 68 countries around the world had more than 10 MW of reported wind power capacity in 2011.
Offshore wind power shows great promise, but to date markets have developed relatively slowly due to high costs and siting and permitting challenges. Most capacity is installed off the coastlines of Europe; the first major offshore wind project outside of Europe began operating in China during 2010. There is a trend toward increasing the size of individual wind turbines as well as the capacity of individual projects; at the same time, interest in community-based wind power projects is on the rise beyond the traditional cooperatives in Denmark and Germany, and interest in small-scale turbines is also increasing.
Biomass Power
Trends in biomass power markets are more difficult to track because of the diversity of feedstock and technologies, and because there are no industry associations that undertake a systematic and comprehensive compilation of global data (as there are for wind and solar PV, for example). However, it is clear that the use of biomass for electricity generation is increasing, particularly in Europe (led by Germany, Sweden, and the UK), the United States, Brazil, China, India, and Japan. Although on a much smaller scale, biomass power has also grown significantly in several other Latin American and Asian countries, including Costa Rica, Malaysia, Mexico, Thailand, and Uruguay, and there is increasing interest in modern biomass power in Africa as well.
Global biomass power capacity reached an estimated 72 GW in 2011. Approximately 88% of biomass power is generated with solid biomass fuels, with the remainder provided by biogas and liquid biofuels.
In many countries, much if not most biomass power capacity...
Table of contents
- Cover image
- Title page
- Table of Contents
- Copyright
- Dedication
- Foreword
- About IEA-RETD
- READy: Renewable Energy Action on Deployment
- List of Case Studies
- Figures
- Tables
- Part One: Trends and Outlooks
- Part Two: Policy Experiences and Lessons Learned
- Part Three: Getting on Track: Lessons Learned for the Road Ahead
- Appendix A. Players in the Field
- Appendix B. Renewable Energy Technologies
- Appendix C. References
- Appendix D. Relevant RETD Studies
- Abbreviations and Acronyms
- Subject Index
Frequently asked questions
Yes, you can cancel anytime from the Subscription tab in your account settings on the Perlego website. Your subscription will stay active until the end of your current billing period. Learn how to cancel your subscription
No, books cannot be downloaded as external files, such as PDFs, for use outside of Perlego. However, you can download books within the Perlego app for offline reading on mobile or tablet. Learn how to download books offline
Perlego offers two plans: Essential and Complete
- Essential is ideal for learners and professionals who enjoy exploring a wide range of subjects. Access the Essential Library with 800,000+ trusted titles and best-sellers across business, personal growth, and the humanities. Includes unlimited reading time and Standard Read Aloud voice.
- Complete: Perfect for advanced learners and researchers needing full, unrestricted access. Unlock 1.5M+ books across hundreds of subjects, including academic and specialized titles. The Complete Plan also includes advanced features like Premium Read Aloud and Research Assistant.
We are an online textbook subscription service, where you can get access to an entire online library for less than the price of a single book per month. With over 1.5 million books across 990+ topics, we’ve got you covered! Learn about our mission
Look out for the read-aloud symbol on your next book to see if you can listen to it. The read-aloud tool reads text aloud for you, highlighting the text as it is being read. You can pause it, speed it up and slow it down. Learn more about Read Aloud
Yes! You can use the Perlego app on both iOS and Android devices to read anytime, anywhere — even offline. Perfect for commutes or when you’re on the go.
Please note we cannot support devices running on iOS 13 and Android 7 or earlier. Learn more about using the app
Please note we cannot support devices running on iOS 13 and Android 7 or earlier. Learn more about using the app
Yes, you can access READy: Renewable Energy Action on Deployment by IEA-RETD,Rolf de Vos,Janet Sawin in PDF and/or ePUB format, as well as other popular books in Business & Energy Industry. We have over 1.5 million books available in our catalogue for you to explore.