This necessary desk reference for every practicing spectroscopist represents the first definitive book written specifically to integrate knowledge about group frequencies in infrared as well as Raman spectra. In the spirit of previous classics developed by Bellamy and others, this volume has expanded its scope and updated its coverage. In addition to detailing characteristic group frequencies of compounds from a comprehensive assortment of categories, the book includes a collection of spectra and a literature search conducted to verify existing correlations and to determine ways to enhance correlations between vibrational frequencies and molecular structure. Particular attention has been given to the correlation between Raman characteristic frequencies and molecular structure.
- Constitutes a necessary reference for every practicing vibrational spectroscopist
- Provides the new definitive text on characteristic frequencies of organic molecules
- Incorporates group frequencies for both infrared and Raman spectra
- Details the characteristic IR and Raman frequencies of compounds in more than twenty major categories
- Includes an extensive collection of spectra
- Compiled by internationally recognized experts
Trusted by 375,005 students
Access to over 1.5 million titles for a fair monthly price.
This chapter presents infrared (IR) and Raman spectroscopy as the two widely used techniques for the determination of molecular structure and for the identification of compounds. These methods cause molecules to undergo changes in vibrational energy state by subjecting them to excitation radiation in selected spectral regions. The molecular vibrational frequencies observed by both techniques are nearly the same but the vibrational band intensities differ because of the different excitation mechanisms and different selection rules. The recent interest in vibrational spectroscopy has been focused on instrumentation, method development, and vibrational analysis. The chapter discusses the rapid development of fourier transform infrared (FT–IR) spectrometry that has revolutionized the applications of infrared spectroscopy. The information content of the infrared and Raman spectra are complementary, and both are necessary for the vibrational analysis of a molecule. The chapters in the book titled The Handbook of infrared and Raman characteristic frequencies of organic molecules review the literature to verify the existing correlations between vibrational frequencies and molecular structure, and determine ways in which correlations between vibrational frequencies and molecular structure could be enhanced.
Infrared (IR) and Raman spectroscopies provide information on molecular vibrations. These methods cause molecules to undergo changes in vibrational energy state by subjecting them to excitation radiation in selected spectral regions. IR and Raman spectroscopy differ in the means by which photon energy is transferred to the molecule and in the instrumentation used. Thus, the information extracted exhibits different characteristics. Infrared and Raman spectroscopy are complementary rather than competing techniques. The molecular vibrational frequencies observed by both techniques are nearly the same, but the vibrational band intensities differ (sometimes markedly so) because of the different excitation mechanisms and therefore different selection rules.
1-1 PRINCIPLES AND SELECTION RULES
The theory and selection rules of IR and Raman transitions have been discussed by Herzberg [1] and Steinfeld [2] in detail. Fateley et al.[19] have discussed the infrared and Raman selection rules for molecular and lattice vibrations by the correlation method. Considerations on the selection rules from the view of molecular symmetry are given by Cotton [3] and Drago [4]. Only qualitative descriptions of the principles and selection rules of IR Raman spectroscopies are given here.
1-1.1 Infrared Spectroscopy
In IR spectroscopy, the vibrational excitation is achieved by radiating the sample with a broad-band source of radiation in the infrared region, which is generally 4000-200 cm−1 (2.5-50 µm). The wavenumber,
in cm−1, is the number of waves per centimeter. It is equal to the reciprocal of the wavelength λ in cm, and is equal to the frequency ν divided by c, the velocity of light (cm sec−1). In the IR region, the wavelength λ is given in micrometers µm or 10−6 m. As illustrated in Fig. 1-1, the molecule is excited to a higher vibrational state by directly absorbing the infrared radiation. The transmittance at a given wavenumber can be calculated according to Eq. 1. The transmission spectrum is then obtained by plotting the transmittance versus the IR wavenumber. Similarly, the absorbance at a given wavenumber can be obtained by using the Beer-Lambert equation (Eq. 2). A plot of absorbance versus wavenumber yields an absorption spectrum.
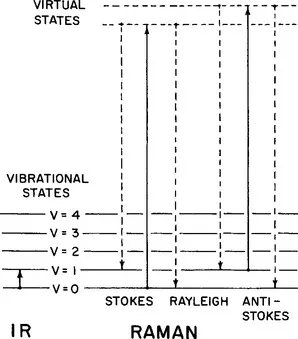
Fig. 1-1 Energy states involved in IR and Raman spectroscopies.
(1)
(2)
where T is transmittance, A is absorbance, I0 is the intensity of the entering radiation (before sample absorption), I is the intensity of the transmitted light (after sample absorption), a is absorptivity, b is cell thickness, and c is concentration.
1-1.2 Raman Spectroscopy
The origin of Raman spectroscopy is an inelastic scattering effect. In this case, the excitation radiation source is monochromatic and is much more energetic than infrared radiation. Elastic and inelastic scattering of radiation by the sample is observed in a Raman experiment. In elastic scattering (Rayleigh scattering), the molecule is excited to a virtual state, and then relaxes to the original vibrational state by re-emitting a photon at the same frequency as the incident light. The molecule “absorbs” no energy from the incident radiation in this case. See Fig. 1-1.
Only a very small fraction of molecules undergo inelastic scattering (Raman scattering). When Raman scattering occurs, the excited molecule relaxes to a different vibrational level, rather than to the original state. The energy carried by an inelastically scattered photon is different from that of the incident light. In a Raman spectrum, the energy difference between the incident and scattered lights appears as a frequency shift between the scattered light ν′ and the excitation frequency ν. These two frequencies, ν and ν′, are related to the vibrational energy by the following equation (see also Fig. 1-1):
(3)
It should be noted that in Raman experiments, the final vibrational state of the molecule can be either higher or lower in energy than the original state. In the case where the final vibrational state is lower in energy than the original one, the scattered photon will exhibit a higher frequency than the incident radiation. Thus, a blue shift from the excitation frequency is observed. Raman bands of this type are called anti-Stokes lines. Similarly, a red shift from the incident radiation is observed when the final state exhibits higher energy than the original state; these Raman bands are referred to as Stokes lines. Since most of the molecules are at ground vibrational state (ν = 0) at room temperature, the Stokes lines exhibit higher Raman intensity than the corresponding anti-Stokes lines, which originate from an elevated vibrational state (ν = 1). Therefore, the Stokes lines are more commonly used for molecular characterization.
If the direction of observation of the radiation scattered by the sample is perpendicular to the direction of the incident polarized laser beam source, and also to its electron vector, polarized Raman spectra can be obtained. A polarizer is placed between the sample and the spectrometer. It can be oriented parallel and perpendicular to the electric vector of the incident radiation. The Raman band intensity ratio, namely the perpendicular polarization intensity divided by the parallel polarization intensity, is called the depolarization ratio ρ. With a laser source, a totally symmetric vibration will generate a polarized Raman band where ρ has a value between 0 and
. A vibration that is not totally symmetric will generate a depolarized Raman band where
.
1-1.3 Selection Rules
In brief, a vibrational mode is IR-active when there is a change in the molecular dipole moment during the vibration; a vibrational mode is Raman-active when there is a change in polarizability during the vibration. Qualitatively, antisymmetric vibrational modes and vibrations due to polar groups are more likely to exhibit prominent IR absorption, while a symmetric vibrational mode is often strong in Raman. Molecules with a ce...
Table of contents
Cover image
Title page
Table of Contents
Copyright
Dedication
PUDDLE
Preface
Acknowledgment
Chapter 1: Introduction
Chapter 2: Alkanes
Chapter 3: Halocompounds
Chapter 4: Alcohols and Phenols
Chapter 5: Ethers and Peroxides
Chapter 6: Alkenes
Chapter 7: Acetylenes
Chapter 8: The –C≡N and –N≡C Groups
Chapter 9: Compounds Containing the Carbonyl Group
Chapter 10: Compounds Containing –NH2, –NHR, and –NR2 Groups
Chapter 18: Selected Infrared and Raman Spectra from the Sadtler Research Laboratories, Division of Bio-Rad Laboratories, Inc. for Compounds with Structures Discussed in Chapters 2–17
Appendix 1: Infrared and Raman Spectra of Common Organic Compounds—From the Aldrich Library of FT-IR Spectra and the Dollish, Fateley and Bentley Collection
Appendix 2: Infrared and Raman Spectra of Selected Carbohydrate, Steroid, Organometallic, and Polymer Spectra from the Schrader Raman/Infrared Atlas of Organic Compounds
Appendix 3: A Summary of Characteristic Raman and Infrared Frequencies
Alphabetical Name Index of Spectra
Molecular Formula Index of Spectra
Index
Frequently asked questions
Yes, you can cancel anytime from the Subscription tab in your account settings on the Perlego website. Your subscription will stay active until the end of your current billing period. Learn how to cancel your subscription
No, books cannot be downloaded as external files, such as PDFs, for use outside of Perlego. However, you can download books within the Perlego app for offline reading on mobile or tablet. Learn how to download books offline
Perlego offers two plans: Essential and Complete
Essential is ideal for learners and professionals who enjoy exploring a wide range of subjects. Access the Essential Library with 800,000+ trusted titles and best-sellers across business, personal growth, and the humanities. Includes unlimited reading time and Standard Read Aloud voice.
Complete: Perfect for advanced learners and researchers needing full, unrestricted access. Unlock 1.5M+ books across hundreds of subjects, including academic and specialized titles. The Complete Plan also includes advanced features like Premium Read Aloud and Research Assistant.
Both plans are available with monthly, semester, or annual billing cycles.
We are an online textbook subscription service, where you can get access to an entire online library for less than the price of a single book per month. With over 1.5 million books across 990+ topics, we’ve got you covered! Learn about our mission
Look out for the read-aloud symbol on your next book to see if you can listen to it. The read-aloud tool reads text aloud for you, highlighting the text as it is being read. You can pause it, speed it up and slow it down. Learn more about Read Aloud
Yes! You can use the Perlego app on both iOS and Android devices to read anytime, anywhere — even offline. Perfect for commutes or when you’re on the go. Please note we cannot support devices running on iOS 13 and Android 7 or earlier. Learn more about using the app
Yes, you can access The Handbook of Infrared and Raman Characteristic Frequencies of Organic Molecules by Daimay Lin-Vien,Norman B. Colthup,William G. Fateley,Jeanette G. Grasselli in PDF and/or ePUB format, as well as other popular books in Scienze fisiche & Spettroscopia e analisi dello spettro. We have over 1.5 million books available in our catalogue for you to explore.