An Introduction to Wavelets and Other Filtering Methods in Finance and Economics presents a unified view of filtering techniques with a special focus on wavelet analysis in finance and economics. It emphasizes the methods and explanations of the theory that underlies them. It also concentrates on exactly what wavelet analysis (and filtering methods in general) can reveal about a time series. It offers testing issues which can be performed with wavelets in conjunction with the multi-resolution analysis. The descriptive focus of the book avoids proofs and provides easy access to a wide spectrum of parametric and nonparametric filtering methods. Examples and empirical applications will show readers the capabilities, advantages, and disadvantages of each method.
- The first book to present a unified view of filtering techniques
- Concentrates on exactly what wavelets analysis and filtering methods in general can reveal about a time series
- Provides easy access to a wide spectrum of parametric and non-parametric filtering methods
Trusted by 375,005 students
Access to over 1.5 million titles for a fair monthly price.
The fundamental reason of writing this book is that we believe the basic premise of wavelet filtering provides insight into the dynamics of economic/financial time series beyond that of current methodology. A number of concepts such as nonstationarity, multiresolution and approximate decorrelation emerge from wavelet filters. Wavelet filtering provides a natural platform to deal with the time-varying characteristics found in most real-world time series, and thus the assumption of stationarity may be avoided. Wavelet filters provide an easy vehicle to study the multiresolution properties of a process. It is important to realize that economic/financial time series may not need to follow the same relationship as a function of time horizon (scale). Hence, a transform that decomposes a process into different time horizons is appealing as it differentiates seasonalities, reveals structural breaks and volatility clusters, and identifies local and global dynamic properties of a process at these timescales.1 Last but not least, wavelet filters provide a convenient way of dissolving the correlation structure of a process across timescales. This would indicate that the wavelet coefficients at one level are not (much) associated with coefficients at different scales or within their scale. This is convenient when performing tasks such as simulations, estimation, and testing since it is always easier to deal with an uncorrelated process as opposed to one with unknown correlation structure. These issues are studied in Chapter 5.
1.1 FOURIER VERSUS WAVELET ANALYSIS
At this point, a natural question to ask would be why not use traditional spectral tools such as the Fourier analysis rather than exploring wavelet methods? Fourier series is a linear combination of sines and cosines. Each of these sines and cosines is itself a function of frequency, and therefore the Fourier transform may be seen as a decomposition on a frequency-by-frequency basis. The Fourier basis functions (sines and cosines) are very appealing when working with stationary time series (see Section 4.1.1 for a definition of a stationary time series). However, restricting ourselves to stationary time series is not very appealing since most economic/financial time series exhibit quite complicated patterns over time (e.g., trends, abrupt changes, and volatility clustering). The Fourier transform cannot efficiently capture these events. In fact, if the frequency components are not stationary such that they may appear, disappear, and then reappear over time, traditional spectral tools (such as the Fourier analysis) may miss such frequency components.
The Fourier transform is an alternative representation of the original time series such that it summarizes information in the data as a function of frequency and therefore does not preserve information in time. This is the opposite of how we observe the original time series, where no frequency resolution is provided. The Gabor transform or short-time Fourier transform (STFT) was developed to achieve a balance between time and frequency by sliding a window across the time series and taking the Fourier transform of the windowed series. The resulting expansion is a function of two parameters: frequency and time shift. Since the STFT is simply applying the Fourier transform to pieces of the time series of interest, a drawback of the STFT is that it will not be able to resolve events when they happen to fall within the width of the window.
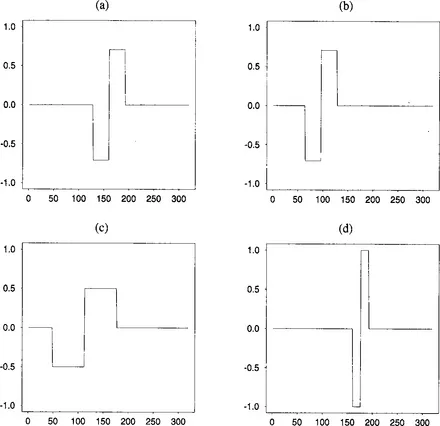
To overcome the fixed time-frequency partitioning, a new set of basis functions are needed. The wavelet transform utilizes a basic function (called the mother wavelet), that is stretched and shifted to capture features that are local in time and local in frequency. Figure 1.1a introduces a square-wave function, based on the Haar wavelet filter, and a shifted version of the same function backward in time (Figure 1.1b). The wavelet filter is long in time when capturing low-frequency events (Figure 1.1c), and hence has good frequency resolution. Conversely, the wavelet is short in time when capturing high-frequency events (Figure 1.1d) and therefore has good time resolution for these events. By combining several combinations of shifting and stretching of the mother wavelet, the wavelet transform is able to capture all the information in a time series and associate it with specific time horizons and locations in time.
FIGURE 1.1 Application of translation and dilation to the square-wave function. (a) Square-wave function. (b) Square-wave function shifted backward (negatively translated) in time. (c) Square-wave function stretched (positively dilated) to twice its original length in time. (d) Square-wave function compressed (negatively dilated) to half its original length.
The wavelet transform intelligently adapts itself to capture features across a wide range of frequencies and thus has the ability to capture events that are local in time. This makes the wavelet transform an ideal tool for studying nonstationary or transient time series. The following examples demonstrate the convenient usage of wavelet-based methods in seasonality filtering, denoising, identification of structural breaks, scaling, separating observed data into timescales (so-called multiresolution analysis) and comparing multiple time series.
1.2 SEASONALITY FILTERING
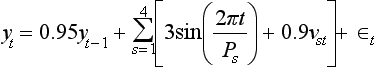
The presence of seasonalities (periodicities) in a persistent process may obscure the underlying low-frequency dynamics. Specifically, the periodic component pulls the calculated autocorrelations down, giving the impression that there is no persistence other than particular periodicities. Consider the following AR(1) process with periodic components:
(1.1)
for t = 1, …, N, P1 = 3, P2 = 4, P3 = 5, and P4= 6. The process has three, four, five, and six period stochastic seasonalities. The random variables ∈t and vst are uncorrelated Gaussian disturbance terms with mean zero and unit variance.
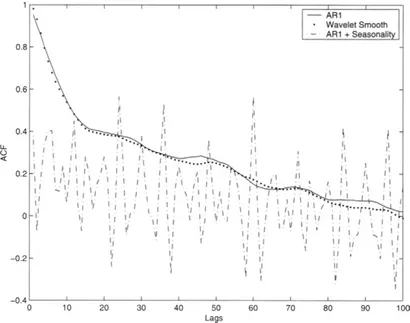
Figure 1.2 presents the autocorrelation functions (ACFs) from a length N= 1000 simulated AR(1) process in Equation 1.1 with and without periodic components. The ACF of the AR(1) process without seasonality (excluding ∑[3 sin (2πt/Ps) + 0.9vst] from the simulated process) starts from a value of 0.95 and decays geometrically.2 However, the ACF of the AR(1) process with the seasonality starts from 0.40 and fluctuates between positive and negative values. The seasonality is evident in the peaks at lags that are multiples of 6 (i.e., at lags 12, 24, 36, etc). The underlying persistence of the AR(1) process in the absence of the seasonality component is entirely obscured by these periodic components.
FIGURE 1.2 Sample autocorrelation function for the simulated AR(1) process (straight line), AR(1) plus seasonal process (dashed line), and wavelet smooth of the AR(1) plus seasonal process (dotted line).
A well-designed seasonal adjustment procedure should therefore separate the data from its seasonal components and leave the underlying inherent nonseasonal structure intact. In Figure 1.2 the solid line is the ACF of the nonseasonal AR(1) dynamics and the dotted lines are the ACF of the seasonally adjusted series using a wavelet multiresolution analysis. As Figure 1.2 displays, using a multiresolution analysis to selectively filter a time series successfully uncovers the nonseasonal dynamics without inducing any spurious persistence into the filtered series. Chapter 4 provides a detailed exposition of the types of wavelet filters used in this example.
1.3 DENOISING
A convenient model for a uniformly sampled process yt is that of the standard signal plus noise model; that is,
(1.2)
For now let us assume st is a deterministic function of t and associated with lower frequency oscillations (i.e., it is relatively smooth). Let us also assume that the noise process ∈t is a sequence of uncorrelated Gaussian random variables with zero mean and variance
. If we want the probability of any noise appearing in our estimate of yt to be as small as possible, as the number of samples goes to infinity, then applying the wavelet transform to yt and thresholding the wavelet coefficients with threshold
is a good strategy. Utilizing this threshold one may then remove (hard thresholding) or shrink toward zero (soft thresholding) wavelet coefficients at each level of the decomposition in an attempt to eliminate the noise from the signal. Inverting the wavelet transform yields a nonparametric estimate of the underlying signal st. Thresholding wavelet coefficients is appealing, since they capture information at different combinations of tim...
Table of contents
Cover image
Title page
Table of Contents
Copyright
Dedication
LIST OF FIGURES
LIST OF TABLES
ACKNOWLEDGMENTS
PREFACE
Chapter 1: INTRODUCTION
Chapter 2: LINEAR FILTERS
Chapter 3: OPTIMUM LINEAR ESTIMATION
Chapter 4: DISCRETE WAVELET TRANSFORMS
Chapter 5: WAVELETS AND STATIONARY PROCESSES
Chapter 6: WAVELET DENOISING
Chapter 7: WAVELETS FOR VARIANCE-COVARIANCE ESTIMATION
Chapter 8: ARTIFICIAL NEURAL NETWORKS
NOTATIONS
BIBLIOGRAPHY
INDEX
Frequently asked questions
Yes, you can cancel anytime from the Subscription tab in your account settings on the Perlego website. Your subscription will stay active until the end of your current billing period. Learn how to cancel your subscription
No, books cannot be downloaded as external files, such as PDFs, for use outside of Perlego. However, you can download books within the Perlego app for offline reading on mobile or tablet. Learn how to download books offline
Perlego offers two plans: Essential and Complete
Essential is ideal for learners and professionals who enjoy exploring a wide range of subjects. Access the Essential Library with 800,000+ trusted titles and best-sellers across business, personal growth, and the humanities. Includes unlimited reading time and Standard Read Aloud voice.
Complete: Perfect for advanced learners and researchers needing full, unrestricted access. Unlock 1.5M+ books across hundreds of subjects, including academic and specialized titles. The Complete Plan also includes advanced features like Premium Read Aloud and Research Assistant.
Both plans are available with monthly, semester, or annual billing cycles.
We are an online textbook subscription service, where you can get access to an entire online library for less than the price of a single book per month. With over 1.5 million books across 990+ topics, we’ve got you covered! Learn about our mission
Look out for the read-aloud symbol on your next book to see if you can listen to it. The read-aloud tool reads text aloud for you, highlighting the text as it is being read. You can pause it, speed it up and slow it down. Learn more about Read Aloud
Yes! You can use the Perlego app on both iOS and Android devices to read anytime, anywhere — even offline. Perfect for commutes or when you’re on the go. Please note we cannot support devices running on iOS 13 and Android 7 or earlier. Learn more about using the app
Yes, you can access An Introduction to Wavelets and Other Filtering Methods in Finance and Economics by Ramazan Gençay,Faruk Selçuk,Brandon J. Whitcher in PDF and/or ePUB format, as well as other popular books in Business & Finance. We have over 1.5 million books available in our catalogue for you to explore.