eBook - ePub
Applied Spectroscopy
A Compact Reference for Practitioners
- 539 pages
- English
- ePUB (mobile friendly)
- Available on iOS & Android
eBook - ePub
Applied Spectroscopy
A Compact Reference for Practitioners
About this book
This book delineates practical, tested, general methods for ultraviolet, visible, and infrared spectrometry in clear language for novice users, and serves as a reference resource for advanced spectroscopists. Applied Spectroscopy includes important information and equations which will be referred to regularly. The book emphasizes reflectance and color measurements due to their common usage in todays spectroscopic laboratories, and contains methods for selectinga measurement technique as well as solar and color measurements. Written by experts in the field, this text covers spectrometry of new materials, ceramics, and textiles, and provides an appendix of practical reference data for spectrometry.
- Book topics include: Practical aspects of spectrometers and spectrometry; Sample preparation; Chemometrics and calibration practices; Reflectance measurements; Standard materials measurements
- An emphasis is placed on reflectance and color measurements due to their common usage in today's spectroscopic laboratories
- Methods for selecting a measurement technique are included as well as solar measurements and reference information on sources, detectors, optical fiber and window materials
Trusted by 375,005 students
Access to over 1 million titles for a fair monthly price.
Study more efficiently using our study tools.
Information
Topic
Physical SciencesSubtopic
Spectroscopy & Spectrum Analysis1
The Practical Basics of Spectrometry
OPTICAL SPECTROMETERS
JERRY WORKMAN, JR., Kimberly-Clark Corporation, Analytical Science and Technology
I. Introduction
II. Types of Spectrometers
A. Discrete Photometers
B. Single Beam
C. Double Beam
D. Double Beam/Dual Wavelength
E. Interferometer Based
F. Open-Path and Emission Spectrometers
III. Details of Spectrometer Components
A. Light Sources
B. Detectors
C. Filters
D. Gratings
E. Beam Splitters
F. Prisms
G. Interferometer Assemblies
H. Polarizers
I. Electronic Components Used in Spectrometry
IV. Properties of Spectrometers
A. Aperture Diameter
B. Entrance and Exit Pupils
C. Bandpass and Resolution
D. Numerical Aperture
E. Attenuation (Light Transmittance Losses in Optical Systems).
F. Etendue
G. Throughput
H. Signal-to-Noise Ratio
I. Dynamic Range
J. Stray Radiant Energy
K. Wavelength Accuracy
L. Wavelength Repeatability
M. Photometric Accuracy
N. Photometric Repeatability
References
Further Reading
I Introduction
The first assumption in spectroscopic measurements is that Beer’s law relationship applies between a change in spectrometer response and the concentration of analyte material present in a sample specimen. The Bouguer, Lambert, and Beer relationship assumes that the transmission of a sample within an incident beam is equivalent to 10 exponent the negative product of the molar extinction coefficient (in L · mol−1 cm−1), multiplied by the concentration of a molecule in solution (in mol · L−1) times the path-length (in cm) of the sample in solution. There are some obvious (and not so obvious) problems with this assumption. The main difficulty in the assumed relationship is that the molecules often interact, and the extinction coefficient (absorptivity) may vary due to changes in the molecular configuration of the sample. The obvious temperature, pressure, and interference issues also create a less than ideal situation for the analyst. However, for many (if not most) analytical problems the relationship holds well enough.
The following are properties of the Bouguer, Lambert, and Beer (Beer’s law) relationship:

where T is the transmittance, I0 is the intensity of incident energy, I is the intensity of transmitted light, ε is the molar extinction coefficient (in L · mol−1 cm−1), c is the concentration (in mol · L−1), and l is the path-length (in cm).
To simplify the previous equation into its more standard form showing absorbance as a logarithmic term, used to linearize the relationship between spectrophotometer response and concentration, gives the following expression as the relationship between absorbance and concentration:

The following statements hold true for what is most often termed Beer’s law: (1) The relationship between transmittance and concentration is nonlinear, and (2) the relationship between absorbance and concentration is linear. Beer’s law is the common basis for quantitative analysis. Knowledge of Beer’s law allows us to calculate the maximum theoretical dynamic range for an instrument using a few simple mathematical relationships.
The goal in the design of an optical spectrometer is to maximize the energy (or radiant power) from a light source through the spectrometer to the detector. The optical throughput for a spectrometer is dependent on multiple factors, such as the light source area, the apertures present within the light path, lens transmittance and mirror reflectance losses, the exit aperture, and the detector efficiency. A simplified model to describe such a system is given below (Note: the reader is referred to Section 4.7 for a definition of throughput). From paraxial optical theory it is known that

This relationship applies when As is the illuminated area of the light source, Ad is the illuminated detector area, ΩEnt is the solid angle subtended by the source at the entrance aperture of the spectrometer, and ΩExit, is the solid angle subtended at the detector by the exit aperture. This relationship is essential to determining the distances of the source and detector from the main spectrometer optical system as well as the size of the entrance and exit apertures (or slits).
Several terms are useful in any discussion of spectrometry; these include the following: selectivity is the specific sensor response to the analyte of interest; sensitivity is the quantifiable level of response from a sensor with respect to the concentration of a specified analyte; and detection limit is the smallest concentration difference that can be detected above the background noise level of a sensor. This is often estimated using two or three times the background root mean square (RMS) noise as a signal and estimating the concentration for this signal level using a calibration curve. Additional details on the physics of spectrometers can be found in Blaker (1970), Bracey (1960), Braun (1987), Ditchburn (1965), Fogiel (1981), and Wist and Meiksin (1986).
II Types of Spectrometerss
The reader is referred to Bracey (1960), Braun (1987), and Wist and Meiksin (1986) for details on conventional spectrometer design.
A DISCRETE PHOTOMETERS
Discrete photometers consist of an irradiance source, discrete interference filters, a sample compartment, and detector, along with appropriate electronics for signal amplification and stabilization of detector signals. The optical configuration for a generic photometer is shown in Fig. 1.
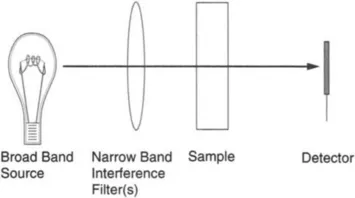
FIG. 1 Interference filter photometer optical configuration.
B SINGLE BEAM
Single-beam spectrometers have a single optical channel that is configured to measure either sample or reference channel but not both simultaneously. The resultant spectrum is the ratio of the transmission spectra from sample and reference measurements. In practice the response of the detector measured with zero photon energy flux is measured as the dark current (Dark). The final transmission (in T units) spectrum from this device is given as

If the spectrometer has any instabilities (optical, mechanical, or electronic), the time constant between sampleand reference measurements becomes critical. Single-beam instruments must either be more inherently stable or alternate between sample and reference measurements at a frequency so as to make negligible the rate of change of the spectrometer. Designs for single- and double-monochromator spectrophotometers, as well as a diode array design, are shown in Figs. 2A–2C. These ...
Table of contents
- Cover image
- Title page
- Table of Contents
- Copyright
- Contributors
- Preface
- Acknowledgments
- 1: The Practical Basics of Spectrometry
- 2: Reflectance Measurements of Solids
- 3: Practical Application of Spectroscopic Measurement
- APPENDIX A: SOURCES, DETECTORS, AND WINDOW MATERIALS FOR UV-VIS, NIR, AND IR SPECTROSCOPY
- APPENDIX B: PRACTICES OF DATA PREPROCESSING FOR OPTICAL SPECTROPHOTOMETRY
- APPENDIX C: INFRARED MICROSPECTROSCOPY
- APPENDIX D
- APPENDIX E: DICHROIC MEASUREMENTS OF POLYMER FILMS USING INFRARED SPECTROMETRY
- Index
Frequently asked questions
Yes, you can cancel anytime from the Subscription tab in your account settings on the Perlego website. Your subscription will stay active until the end of your current billing period. Learn how to cancel your subscription
No, books cannot be downloaded as external files, such as PDFs, for use outside of Perlego. However, you can download books within the Perlego app for offline reading on mobile or tablet. Learn how to download books offline
Perlego offers two plans: Essential and Complete
- Essential is ideal for learners and professionals who enjoy exploring a wide range of subjects. Access the Essential Library with 800,000+ trusted titles and best-sellers across business, personal growth, and the humanities. Includes unlimited reading time and Standard Read Aloud voice.
- Complete: Perfect for advanced learners and researchers needing full, unrestricted access. Unlock 1.4M+ books across hundreds of subjects, including academic and specialized titles. The Complete Plan also includes advanced features like Premium Read Aloud and Research Assistant.
We are an online textbook subscription service, where you can get access to an entire online library for less than the price of a single book per month. With over 1 million books across 990+ topics, we’ve got you covered! Learn about our mission
Look out for the read-aloud symbol on your next book to see if you can listen to it. The read-aloud tool reads text aloud for you, highlighting the text as it is being read. You can pause it, speed it up and slow it down. Learn more about Read Aloud
Yes! You can use the Perlego app on both iOS and Android devices to read anytime, anywhere — even offline. Perfect for commutes or when you’re on the go.
Please note we cannot support devices running on iOS 13 and Android 7 or earlier. Learn more about using the app
Please note we cannot support devices running on iOS 13 and Android 7 or earlier. Learn more about using the app
Yes, you can access Applied Spectroscopy by Jerry Workman Jr.,Art Springsteen,Jerry Workman, Jr. in PDF and/or ePUB format, as well as other popular books in Physical Sciences & Spectroscopy & Spectrum Analysis. We have over one million books available in our catalogue for you to explore.