eBook - ePub
An Introduction to High-Frequency Finance
- 383 pages
- English
- ePUB (mobile friendly)
- Available on iOS & Android
eBook - ePub
An Introduction to High-Frequency Finance
About this book
Liquid markets generate hundreds or thousands of ticks (the minimum change in price a security can have, either up or down) every business day. Data vendors such as Reuters transmit more than 275,000 prices per day for foreign exchange spot rates alone. Thus, high-frequency data can be a fundamental object of study, as traders make decisions by observing high-frequency or tick-by-tick data. Yet most studies published in financial literature deal with low frequency, regularly spaced data. For a variety of reasons, high-frequency data are becoming a way for understanding market microstructure. This book discusses the best mathematical models and tools for dealing with such vast amounts of data.This book provides a framework for the analysis, modeling, and inference of high frequency financial time series. With particular emphasis on foreign exchange markets, as well as currency, interest rate, and bond futures markets, this unified view of high frequency time series methods investigates the price formation process and concludes by reviewing techniques for constructing systematic trading models for financial assets.
Trusted by 375,005 students
Access to over 1.5 million titles for a fair monthly price.
Study more efficiently using our study tools.
Information
1 INTRODUCTION
1.1 MARKETS: THE SOURCE OF HIGH-FREQUENCY DATA
A famous climber, when asked why he was willing to put his life in danger to climb dangerous summits, answered: “Because they are there.” We would be tempted to give the same answer when people ask us why we take so much pain in dealing with high-frequency data. The reason is simple: financial markets are the source of high-frequency data. The original form of market prices is tick-by-tick data: each “tick” is one logical unit of information, like a quote or a transaction price (see Section 2.1). By nature these data are irregularly spaced in time. Liquid markets generate hundreds or thousands of ticks per business day. Data vendors like Reuters transmit more than 275,000 prices per day for foreign exchange spot rates alone.
Thus high-frequency data should be the primary object of research for those who are interested in understanding financial markets. Especially so, because practitioners determine their trading decisions by observing high-frequency or tick-by-tick data. Yet most of the studies published in the financial literature deal with low-frequency, regularly spaced data. There are two main reasons for this. First, it is still rather costly and time-consuming to collect, collate, store, retrieve, and manipulate high-frequency data. That is why most of the available financial data are at daily or lower frequency. The second reason is somehow more subtle but still quite important: most of the statistical apparatus has been developed and thought for homogeneous (i.e., equally spaced in time) time series. There is little work done to adapt the methods to data that arrive at random time intervals. Unfortunately in finance, regularly spaced data are not original data but artifacts derived from the original market prices. Nowadays with the development of computer technology, data availability is becoming less and less of a problem. For instance, most of the exchanges and especially those that trade electronically would gladly provide tick-by-tick data to interested parties. Data vendors have themselves improved their data structures and provide their users with tools to collect data for over-the-counter (OTC) markets. Slowly, high-frequency data are becoming a fantastic experimental bench for understanding market microstructure and more generally for analyzing financial markets.
That leaves the researcher with the problems of dealing with such vast amounts of data using the right mathematical tools and models. This is precisely the subject of this book.
1.2 METHODOLOGY OF HIGH-FREQUENCY RESEARCH
From the beginning, our approach has been to apply the experimental method which has been highly successful in “hard” sciences.1 It consists of three steps, the first one being to explore the data in order to discover the fundamental statistical properties they exhibit with a minimum set of assumptions. This is often called finding the “stylized facts” in the econometric or finance literature. This first step was in fact not so important in the economic literature, because the sparseness of data made it either relatively simple or uninteresting due to the statistical uncertainty.
The second step is to use all of these empirical facts to formulate adequate models. By adequate models, we do not mean models that come from hand-waving arguments about the markets, but rather models that are directly inspired by the empirical regularities encountered in the data. It is the point where our understanding of market behavior and reality of the data properties should meet. There have been many debates between the time series approach and microstructure approach. The first one relying more on modeling the statistical properties of the data and the latter concentrating on modeling market behavior. Both approaches have their value and high-frequency data might be able to reconcile them by enabling us to actually test the microstructure models, Hasbrouck (1998); Rydberg and Shephard (1998).
The third step, of course, is to verify whether these models satisfactorily reproduce the stylized facts found in the data. The ultimate goal is not only a good descriptive model but the ability to produce reasonable predictions of future movements or risks and to integrate these tools into practical applications, such as risk management tools or option pricing algorithms. For decades, practitioners have been developing so-called technical analysis, which is a kind of empirical time series analysis based on rudimentary analytical tools. Although some new academic research has analyzed these trading rules,2 they remain controversial and are looked down upon. We hope that this book will put on a new footing many ideas that have been developed in technical analysis.
We have organized this book along the same lines, we first present the empirical regularities, then we construct models, and lastly we test their power to predict market outcomes.
The novelty of high-frequency data demands to take such an approach. This was not usual in econometrics because so little data were available until the late 1980s. It was quite natural that the researcher’s emphasis was to make sure that the methodology was correct in order to obtain the most information out of the sparse data that were available. Only recently the research community in this field has recognized the importance of the first step: finding empirical facts. This step can already be good research in its own right. A good example is the recent paper by Andersen et al. (2001), where the authors explore in detail the distributional properties of volatility computed from high-frequency data.
Thanks to the development of electronic trading and the existence of various data providers also on the Internet, it is now possible to follow the price formation in real-time. Ideally, the analysis and modeling of the price-generation process should, in real-time, produce results that add value to the raw data. There is strong demand from the market to have, next to the current price, a good assessment of the current risk of the financial asset as well as a reasonable prediction of its future movement. This means that the models should be made amenable to real-time computations and updates. Techniques for doing so will be presented in the remainder of the book. It is possible to develop methods that allow for the easy computation of models and can thus provide almost instantaneous reaction to market events. Although quite popular among practitioners who want to analyze the past developments of prices, those techniques have had little echo, until now, in the academic world. Very few research papers have studied the statistical foundations and properties of those “technical indicators.” In this book (Chapter 3) we provide a unified platform for these methods.
1.3 DATA FREQUENCY AND MARKET INFORMATION
Relating the type of data available for researchers, the effects and the models that are discovered and developed with these different samples, provides insight into the development of research in finance. Figure 1.1 illustrates the sample size versus the measurement frequency of some well-known data sets used in finance. The double logarithmic scale makes the points lie almost on a straight line. The data sample with the lowest frequency is the one used by Froot et al. (1995) of 700 years of annual commodity price data from England and Holland. Beyond 700 years, one is unlikely to find reliable economic or financial data.3 The data with the highest frequency is the Olsen & Associates (O&A) dataset of more than 14 years of high-frequency foreign exchange data. The tick-by-tick data are the highest frequency available. Between those two extremes, one finds the daily series of the Standard & Poors 500 from 1928 to 1991 used by Ding et al. (1993) or the monthly cotton prices used by Mandelbrot (1963) from 1880 to 1940. On this graph, we superimpose those effects that have been identified at these different time scales. One of the questions with data collected over very long periods is whether they really refer to the same phenomenon. Stock indices, for example, change their composition through time due to mergers or the demise of companies. When analyzing the price history of stock indices, the impact of these changes in composition is not obvious. We call this phenomenon the “breakdown of the permanence hypothesis.” It is difficult to assess the quality of any inference as the underlying process is not stationary over decades or centuries. At the other end of the frequency spectrum (i.e. with high-frequency data), we are confronted with the details of the price generation process, where other effects, such as how the data are transmitted and recorded in the data-base (see Chapter 4) have an impact. With data at frequencies of the order of one hour, a new problem arises, due to the fact that the earth turns and the impact of time zones, where the seasonality of volatility becomes very important (as we shall see in Chapter 5) and overshadows all other effects.
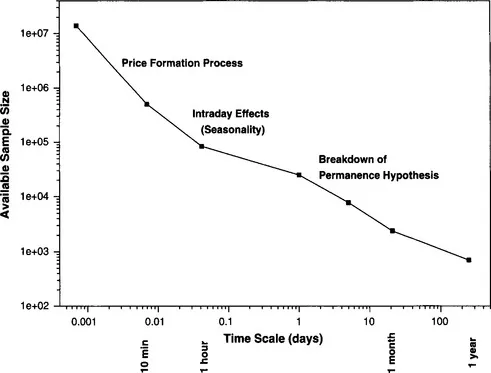
FIGURE 1.1 Available data samples with their typical sizes and frequency. The sample size and the frequency are plotted on a logarithmic scale. The first point corresponds to the O&A database, the last one to the 700 years of yearly data analyzed by Froot et al. (1995), the second to its left to the cotton price data of Mandelbrot (1963), and the daily data are computed from the sample used in Ding et al. (1993) to show long memory in the S&P 500. ...
Table of contents
- Cover image
- Title page
- Table of Contents
- Copyright
- Dedication
- LIST OF FIGURES
- LIST OF TABLES
- PREFACE
- ACKNOWLEDGMENTS
- Chapter 1: INTRODUCTION
- Chapter 2: MARKETS AND DATA
- Chapter 3: TIME SERIES OF INTEREST
- Chapter 4: ADAPTIVE DATA CLEANING
- Chapter 5: BASIC STYLIZED FACTS
- Chapter 6: MODELING SEASONAL VOLATILITY
- Chapter 7: REALIZED VOLATILITY DYNAMICS
- Chapter 8: VOLATILITY PROCESSES
- Chapter 9: FORECASTING RISK AND RETURN
- Chapter 10: CORRELATION AND MULTIVARIATE RISK
- Chapter 11: TRADING MODELS
- Chapter 12: TOWARD A THEORY OF HETEROGENEOUS MARKETS
- BIBLIOGRAPHY
- INDEX
Frequently asked questions
Yes, you can cancel anytime from the Subscription tab in your account settings on the Perlego website. Your subscription will stay active until the end of your current billing period. Learn how to cancel your subscription
No, books cannot be downloaded as external files, such as PDFs, for use outside of Perlego. However, you can download books within the Perlego app for offline reading on mobile or tablet. Learn how to download books offline
Perlego offers two plans: Essential and Complete
- Essential is ideal for learners and professionals who enjoy exploring a wide range of subjects. Access the Essential Library with 800,000+ trusted titles and best-sellers across business, personal growth, and the humanities. Includes unlimited reading time and Standard Read Aloud voice.
- Complete: Perfect for advanced learners and researchers needing full, unrestricted access. Unlock 1.5M+ books across hundreds of subjects, including academic and specialized titles. The Complete Plan also includes advanced features like Premium Read Aloud and Research Assistant.
We are an online textbook subscription service, where you can get access to an entire online library for less than the price of a single book per month. With over 1.5 million books across 990+ topics, we’ve got you covered! Learn about our mission
Look out for the read-aloud symbol on your next book to see if you can listen to it. The read-aloud tool reads text aloud for you, highlighting the text as it is being read. You can pause it, speed it up and slow it down. Learn more about Read Aloud
Yes! You can use the Perlego app on both iOS and Android devices to read anytime, anywhere — even offline. Perfect for commutes or when you’re on the go.
Please note we cannot support devices running on iOS 13 and Android 7 or earlier. Learn more about using the app
Please note we cannot support devices running on iOS 13 and Android 7 or earlier. Learn more about using the app
Yes, you can access An Introduction to High-Frequency Finance by Ramazan Gençay,Michel Dacorogna,Ulrich A. Muller,Olivier Pictet,Richard Olsen in PDF and/or ePUB format, as well as other popular books in Business & Information Management. We have over 1.5 million books available in our catalogue for you to explore.