
eBook - ePub
Earth System Responses to Global Change
Contrasts Between North and South America
- 365 pages
- English
- ePUB (mobile friendly)
- Available on iOS & Android
eBook - ePub
Earth System Responses to Global Change
Contrasts Between North and South America
About this book
This book examines the differences and similarities in the earth system components - the ocean, atmosphere, and the land - between western portions of the northern and southern Western Hemispheres, past, present, and projected. The book carefully examines the physical and biological patterns and responses of given biomes, or ecological communities in the two regions. Special emphasis is placed on the relationship of physicial and biotic systems to biogeochemistry and the evolving biota patterns of land margins and surfaces. The text concludes with an assessment of the direct impact on humans on these biomes, giving full consideration to the land-use drivers of global change.* Integrated view of earth system processes on the west coasts of North and South America
Trusted by 375,005 students
Access to over 1.5 million titles for a fair monthly price.
Study more efficiently using our study tools.
Information
Part I
The Ocean
Chapter 1
Global Climate Change in the Oceans: A Review
Patricio A. Bernal
I Introduction
Here I describe the possible effects on the oceans of global climatic change, with particular emphasis on the Southern Hemisphere. Because CO2 and other greenhouse gases show differential absorption of radiant energy at different wavelengths, a shift in the global radiation budget between incoming and outgoing (mostly infrared) radiation is expected to cause a net increase of global temperature. This change in the energy budget will have a profound effect on climate and consequently on the earth system as a whole. Direct instrumental measurements show a clear monotonic trend of increasing CO2, from 280 to 300 parts per million in 1880 to 335 to 340 in 1980 (Hansen et al., 1981), a trend that has already exceeded the between-centuries range of variation (Webster, 1985). Insights into how these changes will manifest themselves and evolve in time are obtained through numerical modeling of climate, a field of research that has seen dramatic achievements in the past 10 years. General circulation models (GCMs), which are coupled ocean–atmosphere numerical models, include oceanic compartments. Early versions considered a static ocean as an infinite source or sink of heat and humidity. Newer versions of these models considered stratified, two-layer oceans. However, only recently have GCMs begun to include explicit formulations of the dynamics of the ocean interior. This chapter deals exclusively with models that incorporate, to different degrees, ocean interior dynamics.
II The Ocean Response to Increased CO2
Modeling the oceans is difficult because there are major gaps in our knowledge of some oceanic processes, and their parameterization in the absence of new information is uncertain. The most crucial of these uncertainties are the various types of mixing in the oceans, particularly cross-isopycnal mixing (Stewart and Bretherton, 1985). Despite these difficulties, significant progress has been achieved using models ranging from rather simplified ones involving a highly idealized geography on a single hemisphere (Bryan et al., 1982; Spelman and Manabe, 1984; Bryan and Spelman, 1985; Manabe and Bryan, 1985), to a model with quasi-realistic geography (Bryan et al., 1988), to models with fully realistic geography (Stouffer et al., 1989; Manabe et al., 1990).
The usual numerical experiment with these models involves running the model until it reaches an asymptotic equilibrium under normal conditions. That is, a geographically stable configuration of properties is obtained for an atmosphere with a concentration of CO2 similar to the one observed today. The second step is to run the same model using an atmosphere in which the CO2 concentration has been suddenly increased (or decreased as in Manabe and Bryan, 1985) by a given factor (e.g., a factor of 2 or 4). Then these two results are compared to evaluate the transient response of the coupled system to a sudden increase of CO2 at different times from onset of the altered conditions.
Simulations in these models represent the asynchronous combined integration of three compartments: the atmosphere, the upper ocean (< 1000 m), and the deep ocean (> 1000 m). Each of these compartments reacts with a characteristic response time; for example, because of the large heat capacity of the ocean, its response is quite slow compared to the atmosphere. Table I shows characteristic times to reach asymptotic equilibrium for each compartment in the simulations.
Table I
Characteristic Times (in years) to Reach Equilibrium in the Ocean–atmosphere Model
| Compartment | Normal CO2 | 4 × CO2 |
| Atmosphere | 7.8 | 11.8 |
| Upper ocean (< 1000 m) | 850 | 1,290 |
| Deep ocean (> 1000 m) | 23,000 | 35,000 |
Source: Spelman and Manabe (1984).
Although extremely valuable, the experiments just described still suffer from the unrealistic condition of a sudden increase of CO2, compared to the monotonic increase actually observed. This limitation was removed by Stouffer et al. (1989) in an experiment in which they increased the concentration of atmospheric CO2 at a rate of 1% per year (compounded) in order to simulate the trend observed in nature.
As would be expected, the four stages of modeling the ocean–atmosphere response that I have just described (idealized geography, sudden increase; quasirealistic geography, sudden increase; realistic geography, sudden increase; realistic geography, gradual increase) produce different results. These results are summarized in this chapter.
III Idealized Geography Models Responding to a Sudden Increase of CO2
The “geography” of these models consists of paired wedge-shaped continents and oceans that start at the pole and span 60° of longitude at the equator. This unrealistic geography was due to the limited computer capacity at the time and by the complexity of the calculations of the coupled dynamic equations involved. In fact, the computations were conducted on a single pair of wedges and numerical results were extrapolated for one hemisphere by amplifying the results by a factor of 3. Furthermore, to generalize results for the two hemispheres (north and south), this family of models imposed a condition of mirror symmetry at the equator. This severely limited the confidence with which the results can be interpreted for the Southern Hemisphere, where the land/ocean ratio departs radically from 1:1, continental effects are less prominent, the Drake Passage exists, and the Antarctic continent is centered at the pole.
A comparison of normal and increased CO2 responses at asymptotic equilibrium (Spelman and Manabe, 1984) shows that zonally averaged ocean temperatures are higher everywhere compared to the normal climate. The warming in the deep ocean of 7.5 °C is about equal to the large warming of the ocean surface at 65–70° latitude, where ocean stratification is weak and the heat anomaly can penetrate from the surface into the deeper ocean (Spelman and Manabe 1984). Deep-ocean warming is significantly greater than that experienced by the surface layer expressed per unit area. The smallest temperature increase occurs in surface tropical waters, coinciding with the smallest atmospheric warming. In contrast to what happens in the atmosphere, the largest increase in temperature at the ocean surface does not occur at the pole (a distinct possibility in this model because of its geometry) but in a very shallow layer near 75° latitude. This difference is explained by the strong ocean stratification observed at this latitude, which partially insulates the surface water from the deeper ocean.
Figure 1 shows the transient response after 25 years of warming following a sudden increase of CO2. Major results are as follows: (1) the surface layer of the model atmosphere at high latitudes is almost decoupled from the ocean; (2) near the sea-ice margin at 75° latitude, warming of the surface is limited to a shallow layer because the strong stratification caused by the sharp halocline insulates deeper layers; (3) maximal warming in the ocean occurs at subarctic (subantarctic) latitudes around 55–60°; (4) penetration of surface warming into the deep ocean is exceedingly slow and has only a small influence on the latitudinal distribution of zonally averaged temperature in the upper (< 1000 m) model ocean (Spelman and Manabe, 1984).
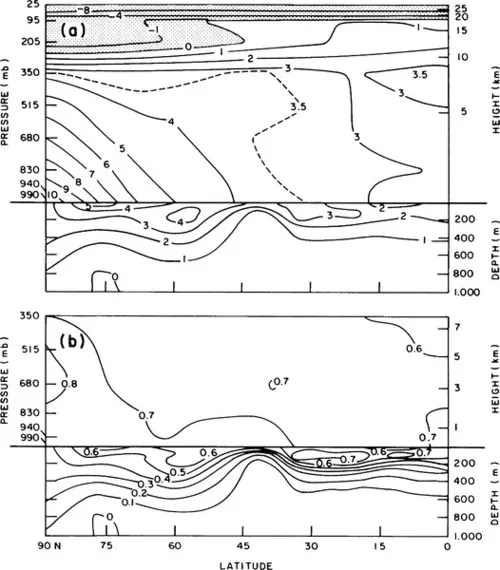
Fig. 1 Transient response after 25 years of a fourfold increase in CO2. Latitude height-depth distributions from the transient response study showing (a) the zonally averaged temperature at 25 years minus initial temperature (kelvin) and (b) the fractional response of zonally averaged temperature, R = (Ti - T0)/(Tas – T0), where Ti is the temperature at year i of the simulation run, T0 is the temperature at year 0 of the simulation run, and Tas is the temperature at asymptotic equilibrium. R measures the fraction of the total response realized at the picture time. (Redrawn from Spelman and Manabe, 1984.)
The surface circulation pattern established after 20 years in response to a fourfold increase in atmospheric CO2 (Bryan and Spelman, 1985) shows the presence of the subtropical anticyclonic gyre and two cyclonic gyres at higher latitudes, the latter a major difference from the normal pattern of circulation; the salinity distribution at the surface shows higher salinities in the subtropical anticyclonic gyre and two pools of very low salinity water (< 32 per mil) close to the west and east boundaries caused by increased runoff from the continents. This pool of fresher water implies an increased input of nutrient from runoff and should have an impact on primary production.
Figure 2 shows the thermohaline circulation pattern. During the transient response period (Fig. 2b), water formed at the surface in high latitudes is not dense enough to sink to the bottom and flows as intermediate water toward the equator at mid-depths (approximately 600 m). This leads to (1) formation of a clockwise cell in the deep ocean and (2) shallowing and partial collapse of the “equilibrium” counterclockwise cell, which has two nuclei at 25° and 60° latitude. The shallow cells induced by Ekman transport remain much the same in all three cases of Fig. 2 because zonal wind stress does not diminish after the onset of the increased CO2 conditions. Bryan and Spelman (1985) highlight the far-reaching consequences of the partial collapse of the thermohaline circulation, which decreases the capacity of the ocean to take up CO2.
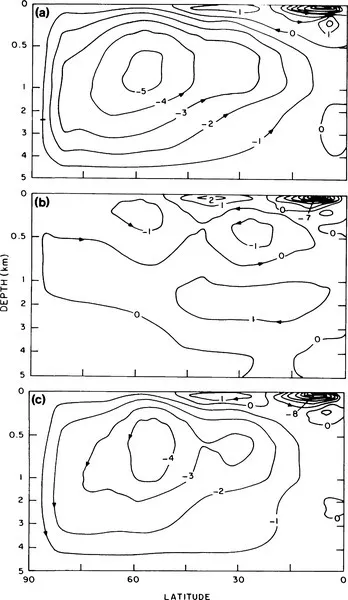
Fig. 2 Total meridional circulation. The zonally integrated equilibrium circulation, mostly thermohaline below the surface layer, in units of Mt s− 1. Overturning in the meridional plane shows a main counterclockwise circulation, with a concentrated downward branch near the pole and a broad upward branch close to the equator. Close to the surface, smaller circulation cells are associated with Ekman pumping or suction. Simulations for normal and increased CO2 tend to show similar patterns, whereas the transient response after ...
Table of contents
- Cover image
- Title page
- Table of Contents
- Copyright page
- Contributors
- Preface
- Part I: The Ocean
- Part II: Climate Controls
- Part III: Hydrology and Geomorphology
- Part IV: Biogeochemistry
- Part V: Intertidal
- Part VI: Plants
- Part VII: Animals
- Part VIII: Managed Systems and Human Impacts
- Index
Frequently asked questions
Yes, you can cancel anytime from the Subscription tab in your account settings on the Perlego website. Your subscription will stay active until the end of your current billing period. Learn how to cancel your subscription
No, books cannot be downloaded as external files, such as PDFs, for use outside of Perlego. However, you can download books within the Perlego app for offline reading on mobile or tablet. Learn how to download books offline
Perlego offers two plans: Essential and Complete
- Essential is ideal for learners and professionals who enjoy exploring a wide range of subjects. Access the Essential Library with 800,000+ trusted titles and best-sellers across business, personal growth, and the humanities. Includes unlimited reading time and Standard Read Aloud voice.
- Complete: Perfect for advanced learners and researchers needing full, unrestricted access. Unlock 1.5M+ books across hundreds of subjects, including academic and specialized titles. The Complete Plan also includes advanced features like Premium Read Aloud and Research Assistant.
We are an online textbook subscription service, where you can get access to an entire online library for less than the price of a single book per month. With over 1.5 million books across 990+ topics, we’ve got you covered! Learn about our mission
Look out for the read-aloud symbol on your next book to see if you can listen to it. The read-aloud tool reads text aloud for you, highlighting the text as it is being read. You can pause it, speed it up and slow it down. Learn more about Read Aloud
Yes! You can use the Perlego app on both iOS and Android devices to read anytime, anywhere — even offline. Perfect for commutes or when you’re on the go.
Please note we cannot support devices running on iOS 13 and Android 7 or earlier. Learn more about using the app
Please note we cannot support devices running on iOS 13 and Android 7 or earlier. Learn more about using the app
Yes, you can access Earth System Responses to Global Change by Harold A. Mooney,Eduardo R. Fuentes,Barbara I. Kronberg in PDF and/or ePUB format, as well as other popular books in Biological Sciences & Global Warming & Climate Change. We have over 1.5 million books available in our catalogue for you to explore.