![]()
Appendix One
Index of Political Development
Studies of tax effort by fiscal economists, especially those by Raja Chelliah and Roy Bahl, provide the methodological background of this appendix.
1 The use of variations in tax ratios to account for meaningful intercountry differences in the size of the public sector, obscures the fact that rich nations can extract more because they have a larger base to tax. The estimation of tax capacity and control for the differences in available resources is a preliminary step in the direction of the estimation of tax effort. Real tax ratio (T/GNP) is the quotient of total taxes collected by the government over total output. Taxable capacity is the revenue collected given available resources relative to other nations in the system. It is calculated by the predicted values (
/GNP) obtained by regressing the real tax ratio against economic indicators of differences in resource base. Finally, the tax effort index is the quotient of real tax ratio to estimated tax capacity. This appendix is devoted almost exclusively to the methodological problems encountered in the derivation of the tax effort index.
Tax Capacity: Alternative Models
Regression techniques have been used to control for differences in taxable resources among nations. Several equations have been proposed as the best representation of tax capacity. The two most widely employed and refined are:
1. Tax/GNP = A + B1 Exports/GNP + B2 Agricultural Production/GDP + B3 Mineral Production/GDP + Error
2. Tax/GNP = A + B1 GNP/Total Population + B2 Nonmineral Exports/GDP + B3 Mineral Production/GDP + Error
We chose equation 1 for a number of reasons. The data for the independent variables are more complete and reliable for this equation. This is particularly true for nonmineral exports that fluctuate unexpectedly from year to year, due to major changes in reporting. Also, in the case of developing countries, agricultural production measures directly the proportion of total output that is extremely difficult for governments to tax; while GNP per capita used in equation 2 does not directly reflect this component. Finally, the results obtained from both equations are very similar, but generally equation 1 provides more stable coefficients and predicted values. This is congruent with our a priori expectation of the way a political development indicator would behave.
Measurement Error
Previous studies employed three-year moving averages to minimize the year-by-year fluctuations of the indicators caused by financial fluctuations and, more importantly, by inconsistent reporting. Because a complete time series is now available we controlled for fluctuations by pooling the time series and introducting directly a time component to detrend the equation. The resulting equation is as follows:
Tax/GNP = A + B1 Time + B2 Export/GNP + B3 Agricultural Production/GDP + B4 Mineral production/GDP + Error
where:
Time = 1, 2, 3, 4, . . . , 26 corresponding to 1950, 1951, 1952, . . . 1975.
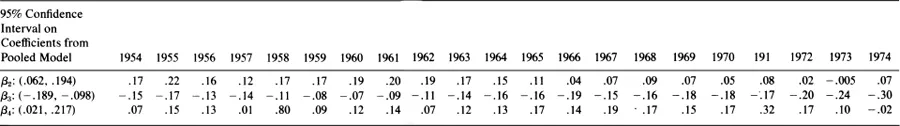
Pooling improves the consistency and efficiency of estimates. Comparisons of time series estimates with those obtained from year-by-year estimates produced coefficients that in most cases are within the confidence interval of those obtained in the time series (see table A1.1). Note that prior to 1973, very few coefficients obtained from the cross-sectional regressions fall outside the 95 percent confidence interval obtained from the pooled model. Major deviations occur only for the exports coefficients in 1966 and for the mining/GDP for 1957 and 1971. The increased instability for 1973 and 1974 results mainly from the differences in the sample of nations used in the estimate caused by drastic reductions in data availability that also prevent cross-sectional estimates for 1950–53.
Table A1.1. Confidence Interval Table
Where coefficients are for
2 export/GNP
3 agricultural production/GDP
4 mining production/GDP
The confidence intervals in the left-hand column are derived on the basis of estimates taken from the pooled model. The numbers in each subsequent column to the right are the value of coefficients taken from the cross-section regression one year at a time. For example, the first value (.17) under the year 1954 is the regression coefficient
for the cross-section model for that year. It is contained in the confidence interval (.062, .194) of the parameter
β2.
Tax capacity values, measured by predicted values (Tax/GNP), are also very close to those obtained in the year-by-year estimates; but they do not fluctuate drastically in years when the sample of nations is reduced. The trend in the series is positive and large. This reflects the fact that most developing nations have increased governmental participation in all phases of economic life, partly as a result of the increasing complexity of their developing economies, but probably largely as a consequence of the process of socialization and centralization of governmental activities as governments take a direct role in the national economic life. Thus, the index of taxable capacity obtained from the pooled time series regression are stable over time. An added advantage—not exploited thus far—is the possibility of directly extrapolating future points for short time-periods.
Centralized Economies
There are profound differences between the taxation systems of nations with centralized economies and nations with open economies. In open economies governments extract resources by taxing directly or indirectly income from industry, commerce, labor, and agriculture. On the other hand, in centrally controlled economies governments extract resources by taxing directly or indirectly profits from nationalized industries, by controlling labor salaries, and by centralizing the purchasing and selling of industrial and agricultural commodities. There is no need, therefore, in centralized economies to tax either mining operations or exports and imports. Thus, the inclusion of Communist nations in the sample (China, North Vietnam, and North Korea) drastically affected the coefficients for exports and mining, reversing the signs and rendering the estimate insignificant. Clearly two models are at work within the same equation. Given the number of available cases, the simplest solution was to incorporate a dummy variable for the different types of economies and determine its effects. We proceeded as follows:
Tax/GNP = A + B1 Time + B2 Type of Economy + B3 Exports/GNP + B4 Agricultural Production/GDP + B5 Mineral Production/GDP + Error
where:
Type of economy | 0 = Open Economy |
1 = Centralized Economy |
With this dummy coefficient, we obtain stable, statistically significant, and theoretically acceptable results. To assure that the coefficients for all countries were stable, we added, in the case of each independent indicator, interactive terms, first for time, then for open and closed economies, and, finally, for both in combination. The more complicated formulations were not justified. Changes in slope over time did not materialize, and results were insignificant. Similarly, changes in slope for independent variables were absent in the case of centralized economies alone. The simplest equation was clearly the most appropriate given our data restrictions.
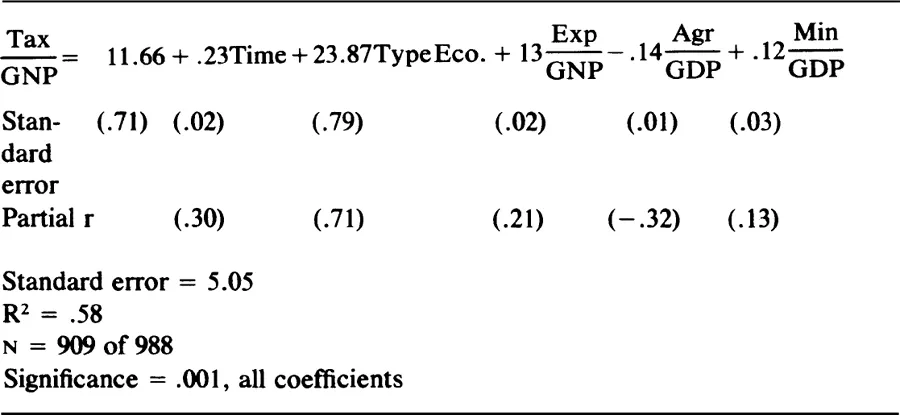
Estimate of Tax Capacity
The final estimate replicates closely the findings of previous studies on this subject, despite our more limited sample. The results can be summarized as shown in table A1.2.
Table A1.2. Statistical Estimation of Tax Capacity
First, the 40 percent of the variance that is not explained we attribute to political rather than economic capabilities. These numerical results are very similar to those obtained in previous estimates.2 Second, the magnitude of the coefficients indicate strong effect of all independent variables on the tax ratio, and affect the estimate in the predicted direction. Thus, the coefficient for centralized economies is strong and positive, indicating the pervasive intervention of government in economic activities. All results are significant.
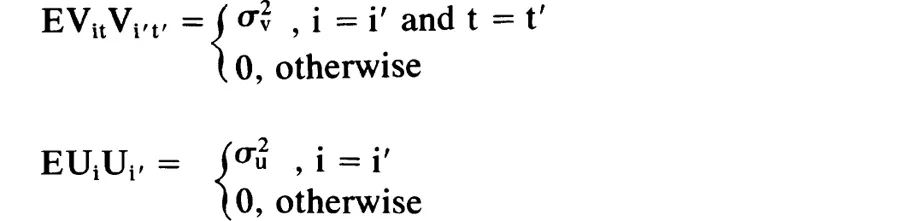
The application of ordinary least-squares estimation procedure to the pooled (time series of a cross-section) model is justified so long as one satisfies some basic assumptions about the error term
it where i stands for country, and t for time. The error term may be encompassed by two statistically independent parts: a country-specific effect and a remainder.
It is assumed that:
This rules out autocorrelation among residuals for each country, covariation between residual...