The impacts of climate change can already be felt in society and on the Earth itself. As new evidence of the environmental impact of climate change is constantly emerging, we are forced to confront the significance of our political decisions about who will pay the price of responding to a changing climate. In the rush to avoid or reduce the repercussions of climate change, we need to ensure that the burden is evenly distributed or run the risk of creating injustice.
Climate Change and Social Justice demonstrates that the problem of how to distribute the costs of climate change is fundamentally a problem of justice. If we ignore the concerns addressed this book, the additional burdens of climate change will fall on the poor and vulnerable.
Jeremy Moss brings together today's key thinkers in climate research, including Peter Singer, Ross Garnaut and David Karoly, to respond to these important issues.
- 264 pages
- English
- ePUB (mobile friendly)
- Available on iOS & Android
eBook - ePub
About this book
Trusted by 375,005 students
Access to over 1.5 million titles for a fair monthly price.
Study more efficiently using our study tools.
Information
Subtopic
EcologyIndex
Biological SciencesPart I
Science, Fairness and Responsibility
1
The Blame Game
Assigning Responsibility for the Impacts of Anthropogenic Climate Change
Concern about the adverse impacts of anthropogenic climate change has grown over the last decade, particularly as the scientific assessments of the Intergovernmental Panel on Climate Change (IPCC) have provided higher confidence conclusions that recent warming of the climate system is unequivocal and that, at the global scale, most of this warming is due to human activity. The recent IPCC assessment in 2007 concluded ‘Most of the observed increase in global average temperatures since the mid-20th century is very likely due to the observed increase in anthropogenic greenhouse gas concentrations’.1 This conclusion refers to global-scale climate change, but it is the local and regional impacts of climate change that affect people, society and ecosystems. In addition, the important anthropogenic greenhouse gases, carbon dioxide, methane, nitrous oxide and halocarbons, have long atmospheric residence times and are well-mixed, so that increases in their concentrations are due to integrated emissions over extended periods. Blaming or assigning responsibility for specific regional impacts of climate change to different sources of anthropogenic greenhouse gases, such as individual countries or companies, is difficult but has been considered in principle.2 It involves linking changes in greenhouse gas concentrations to different sources of emissions and linking regional impacts of climate change to increases in greenhouse gas concentrations.
A brief review is presented of recent studies that have considered different aspects of this problem. Approaches to quantifying the influence on the global climate system due to emissions of different greenhouse gases are discussed in the next section, followed by an assessment of studies linking regional climate impacts to changes in concentrations of greenhouse gases. Although studies of end-to-end attribution from greenhouse gas emissions to increasing concentrations to changes in climate forcing to global climate change and finally to regional impacts are in their infancy,3 it appears to be human nature to want to assign blame. Litigation related to climate change impacts already is occurring and will almost certainly increase in the future. The science linking impacts to greenhouse gas emissions is a critical aspect required to support such litigation.
Responsibility for Changes in Climate Forcing
The metric that is commonly used to represent the relative importance of different external factors in causing changes in the global climate is the global average radiative forcing, the change in net downward radiation at the top of the troposphere at a specific time relative to pre-industrial times.4 As shown in figure 1, the largest single factor contributing to the increase in radiative forcing in 2005 was the observed increase in the atmospheric concentration of carbon dioxide, followed by the increases in the other anthropogenic long-lived greenhouse gases, methane, halocarbons and nitrous oxide.
The concentration of carbon dioxide in the atmosphere in 2005 was 379 parts per million (ppm), about 30 per cent higher than its pre-industrial concentration and higher than at any time in the past 650 000 years.5 The warming influence due to the increases in anthropogenic greenhouse gases was offset to some extent by the cooling influence of anthropogenic aerosols, small particles and droplets in the atmosphere due to industrial activity, that cause a negative radiative forcing (see figure 1). Hence, the net anthropogenic radiative forcing is less than the total radiative forcing due to all long-lived greenhouse gases and similar in magnitude to the radiative forcing due to carbon dioxide alone.
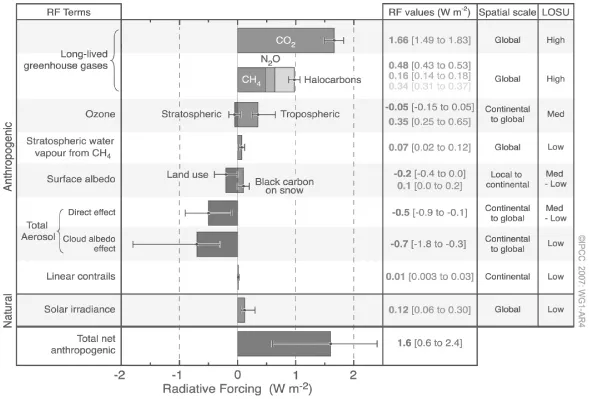
Figure 1: Global Average Radiative Forcing (RF) Estimates and Ranges in 2005
Global average radiative forcing (RF) estimates and ranges in 2005 for anthropogenic carbon dioxide (CO2), methane (CH4), nitrous oxide (N2O) and other important agents and mechanisms, together with the typical geographical extent (spatial scale) of the forcing and the assessed level of scientific understanding (LOSU). The net anthropogenic radiative forcing and its range are also shown. These require summing asymmetric uncertainty estimates from the component terms, and cannot be obtained by simple addition. Additional forcing factors not included here are considered to have a very low LOSU. Volcanic aerosols contribute an additional natural forcing but are not included in this figure due to their episodic nature. The range for linear contrails does not include other possible effects of aviation on cloudiness.
Source: Reproduced from Figure SPM.2, IPCC, ‘Summary for Policymakers’.
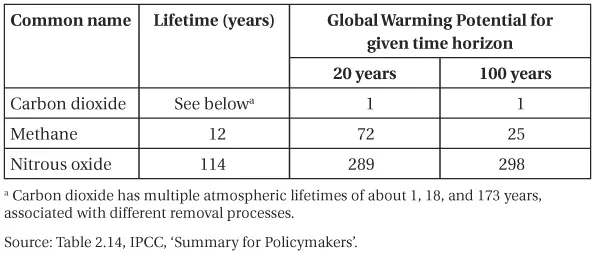
The Global Warming Potential index (GWP) was developed to understand the relative importance of different emissions of greenhouse gases to the radiative forcing in 2005 and to future changes in radiative forcing.6 As used by the IPCC, the GWP is:
an index, based upon radiative properties of well-mixed greenhouse gases, measuring the radiative forcing of a unit mass of a given well-mixed greenhouse gas in the present-day atmosphere integrated over a chosen time horizon, relative to that of carbon dioxide. The GWP represents the combined effect of the differing times these gases remain in the atmosphere and their relative effectiveness in absorbing outgoing thermal infrared radiation.7
The atmospheric lifetimes and GWPs for methane and nitrous oxide are compared with those for carbon dioxide in table 1. For example, the climate forcing over 100 years due to the emission of 1 unit of methane is the same as that due to the emission of 25 units of carbon dioxide. Since the lifetimes of these greenhouse gases are long, their current concentrations in the atmosphere depend not only on current emissions but also on the total emissions of each gas over its atmospheric lifetime.8 In addition, the atmospheric concentration of a given greenhouse gas depends on total global emissions, not local emissions, over the lifetime of the gas, as long lifetimes and atmospheric circulation mean that such gases are well-mixed, with only relatively small spatial variations in concentrations. In other words, the carbon dioxide currently circulating in the atmosphere is distributed fairly evenly across the globe, and consists of molecules emitted both recently and over at least the past hundred years, due to the long lifetime of the gas.
Table 1: Atmospheric Lifetimes and Global Warming Potentials Relative to Carbon Dioxide of Several Long-lived Greenhouse Gases
The responsibility for changes in climate forcing can be determined from the time history of the emissions of different greenhouse gases by different countries9 or companies. The effects of the different greenhouse gases relative to carbon dioxide can be evaluated by multiplying the emissions of a specific greenhouse gas by its GWP and then summing the emissions over the different greenhouse gases. This gives the carbon dioxide–equivalent emission, the amount of carbon dioxide emissions that would cause the same radiative forcing, over a given time horizon, as an emitted amount of a mixture of greenhouse gases.
The total carbon dioxide–equivalent emissions of all greenhouse gases in 2004 for different regional groups are shown in figure 2 as per capita emissions, together with the populations for each of the regional groups. Both the largest per capita emissions and the largest total emissions of greenhouse gases are from the US-Canada grouping. While Australia has a relatively small proportion of the total global greenhouse gas emissions, this is disproportionately large given Australia’s small population. Australia’s per capita greenhouse gas emissions are comparable to those of the US and Canada and among the highest per capita emissions of any country in the world. Given that it is the total greenhouse gas emissions over a period of time that have caused the changes in radiative forcing, a reasonable measure of a country’s or company’s contribution to the changes in global climate forcing would be its share of the total historical greenhouse gas emissions.10
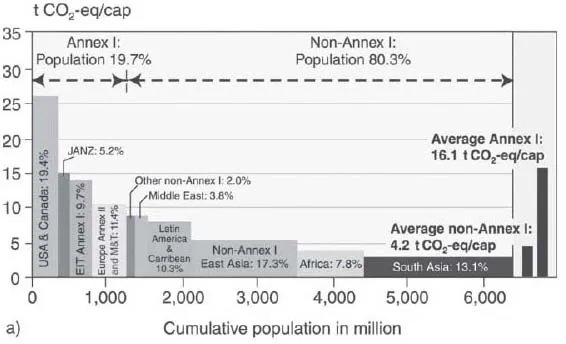
Figure 2: Distribution of Regional Per Capita Greenhouse Gas (GHG) Emissions According to the Population of Different Country Groupings in 2004
The percentages in the bars indicate a region’s share in global GHG emissions.
Source: Reproduced from Figure 2.2(a), IPCC, Climate Change 2007: Synthesis Report.
Attribution of Regional Climate Change and Its Impacts
A recent assessment of progress on the attribution of observed global and regional climate changes to different forcing factors has been provided by the IPCC.11 This provided higher confidence assessments of the role of increasing greenhouse gases in causing recent global climate change, concluding ‘Greenhouse gas forcing has very likely caused most of the observed global warming over the last 50 years’12 and ‘It is likely that there has been a substantial anthropogenic contribution to surface temperature increases in every continent except Antarctica since the middle of the 20th century’13, as shown in figure 3.
It also noted that difficulties remain in attributing temperature changes at smaller than continental scales to anthropogenic climate forcing, due to the increasing magnitude of natural climate variability at smaller spatial scales and the possible confounding influences of different climate forcing factors at local scales, including land use change and aerosols, in addition to increases in greenhouse gases. For other climate variables apart from temperature, it is even harder to identify the small climate change response to increasing greenhouse gases relative to the larger natural climate variability.
Analysis of climate model simulations shows a coherent pattern of regional temperature increases, as well as increased global-average temperature, in response to increased greenhouse gas forcing. Hence, the attribution of observed global-average temperature increases to increasing concentrations of greenhouse gases means that there must be an associated climate change signal at regional scales, even if this is small and possibly dwarfed by climate variability at these scales. Since the impacts of climate change occur at local and regional scales, these are already likely to be affected by the contributions to regional temperature increases due to anthropogenic climate forcing.
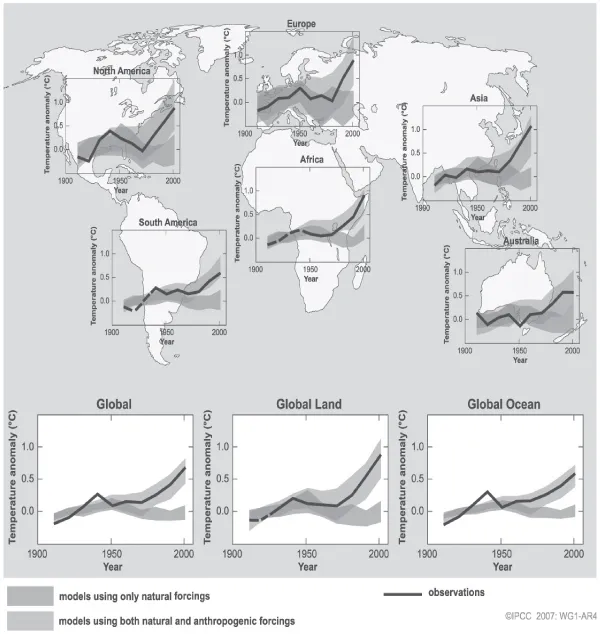
Figure 3: Comparison of Observed Continental- and Global-scale Changes in Surface Temperature with Results Simulated by Climate Models Using Natural and Anthropogenic Forcings
Decadal averages of observations are shown for the period 1906 to 2005 (black line) plotted against the centre of the decade and relative to the corresponding average for 1901–1950. Lines are dashed where spatial coverage is less than 50 per cent. Darker shaded bands show the 5–95 per cent range for 19 simulations from five climate models using only the natural forcings due to solar activity and volcanoes. Lighter shaded bands show the 5–95 per cent range for 58 simulations from 14 climate models using both natural and anthropogenic forcings.
Source: Reproduced from Figure SPM.4, IPCC, ‘Summary for Policymakers’.
Despite the difficulties in identifying an anthropogenic contribution to recent observed temperature increases at regional scales, this has been undertaken in several recent studies14. When individual regions of spatial scale about 500 km are considered, the observed warming trends over the last fifty years are statistically significant, cannot be explained by natural climate variations and are consistent with the expected response to increasing greenhouse gases in the majority of the regions,15 as shown in figure 4. Hence, the anthropogenic contribution to recent regional warming is relatively large and likely to be contributing to regional climate impacts.
Given that the anthropogenic climate change signal-to-noise ratio is largest for temperature, it is likely that climate change impacts due to regional warming will be easiest to identify. A recent global assessment of significant observed changes in biological and physical systems since at least 1970 concluded that anthropogenic climate change, particularly temperature increases, was already having significant impacts on some physical and biological systems globally and in some continents.16 These impacts in physical systems included enhanced melting of glaciers, later freezing and earlier melting of ice on rivers and lakes, earlier spring peaks in river runoff, warmer temperatures in rivers and lakes, and increased coastal inundation and erosion due to sea level rise. Impacts in biological systems included earlier spring dates for seasonal events such as budding and flowering of plants, egg laying and migration of birds, and upward and poleward range shifts for insects. Some specific regional impacts have been linked more formally to anthropogenic climate change, such as melting of glaciers across the globe17 and earlier snow melt and spring peak in river flow in the western United States.18
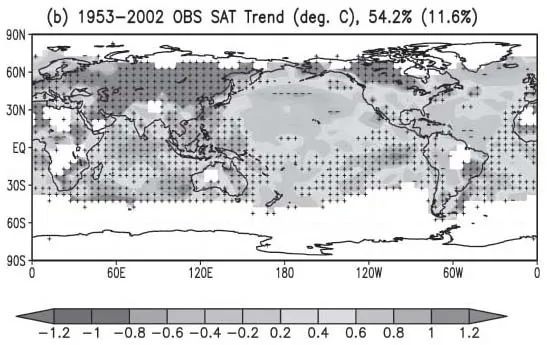
Figure 4: Observed Trends in Surface Temperature over the Period 1953–2002
Plus (minus) symbols mark individual grid boxes where the observed t...
Table of contents
- Climate Change and Social Justice
- Part I Science, Fairness and Responsibility
- Part II Climate Change and Vulnerable Groups
- Part III Policy Implications
Frequently asked questions
Yes, you can cancel anytime from the Subscription tab in your account settings on the Perlego website. Your subscription will stay active until the end of your current billing period. Learn how to cancel your subscription
No, books cannot be downloaded as external files, such as PDFs, for use outside of Perlego. However, you can download books within the Perlego app for offline reading on mobile or tablet. Learn how to download books offline
Perlego offers two plans: Essential and Complete
- Essential is ideal for learners and professionals who enjoy exploring a wide range of subjects. Access the Essential Library with 800,000+ trusted titles and best-sellers across business, personal growth, and the humanities. Includes unlimited reading time and Standard Read Aloud voice.
- Complete: Perfect for advanced learners and researchers needing full, unrestricted access. Unlock 1.5M+ books across hundreds of subjects, including academic and specialized titles. The Complete Plan also includes advanced features like Premium Read Aloud and Research Assistant.
We are an online textbook subscription service, where you can get access to an entire online library for less than the price of a single book per month. With over 1.5 million books across 990+ topics, we’ve got you covered! Learn about our mission
Look out for the read-aloud symbol on your next book to see if you can listen to it. The read-aloud tool reads text aloud for you, highlighting the text as it is being read. You can pause it, speed it up and slow it down. Learn more about Read Aloud
Yes! You can use the Perlego app on both iOS and Android devices to read anytime, anywhere — even offline. Perfect for commutes or when you’re on the go.
Please note we cannot support devices running on iOS 13 and Android 7 or earlier. Learn more about using the app
Please note we cannot support devices running on iOS 13 and Android 7 or earlier. Learn more about using the app
Yes, you can access Climate Change and Social Justice by in PDF and/or ePUB format, as well as other popular books in Biological Sciences & Ecology. We have over 1.5 million books available in our catalogue for you to explore.