This textbook is a comprehensive introduction to applied spatial data analysis using R. Each chapter walks the reader through a different method, explaining how to interpret the results and what conclusions can be drawn. The author team showcases key topics, including unsupervised learning, causal inference, spatial weight matrices, spatial econometrics, heterogeneity and bootstrapping. It is accompanied by a suite of data and R code on Github to help readers practise techniques via replication and exercises.
This text will be a valuable resource for advanced students of econometrics, spatial planning and regional science. It will also be suitable for researchers and data scientists working with spatial data.
Trusted by 375,005 students
Access to over 1.5 million titles for a fair monthly price.
1 It is difficult to define what R is clearly. On the one hand, it is software for quantitative analyses in various fields. On the other hand, R is also a programming language that is oriented towards data analysis. What’s more, it is also a development (variant) of the S language developed in Bell Laboratories, which is also intended for quantitative analyses. The most appropriate description seems to be the statement that R is an environment (with its own programming language) which is focused on the processing of data and their (statistical) analysis, along with wide visualisation (graphic) possibilities. This program belongs to the so-called free and open software and is distributed and developed under the GNU GPL license. Therefore, the development of R is characterised by both all the advantages and drawbacks associated with such a licensing model and development method. R is available for all major platforms: Windows, MacOS and the UNIX family (i.e. Linux, FreeBSD and others). An important feature of the R environment is its flexibility and the possibility of constantly expanding applications. This is best seen by the number of additional packages available in the official repository. At the moment (June 2020), there are nearly 16,000 packages. For comparison, at the end of 2014, there were around 6000 official packages available. R also integrates well with other software languages such as C, C++ or Fortran.2 Unlike many other programs distributed under a free license, R has very well ordered and rich documentation and a wide literature on its applications. Due to the fact that the first stable version of R appeared in 2000, it can be safely stated that the software is currently at a mature stage; more and more often it replaces other more specialised statistical packages in scientific research or commercial applications. Specialised packages also enable direct preparation of reports or scientific publications in the R environment by integrating the text with the results of calculations. These packages allow one to use Markdown and LaTeX language variations to format such texts.
1.2 The R software interface
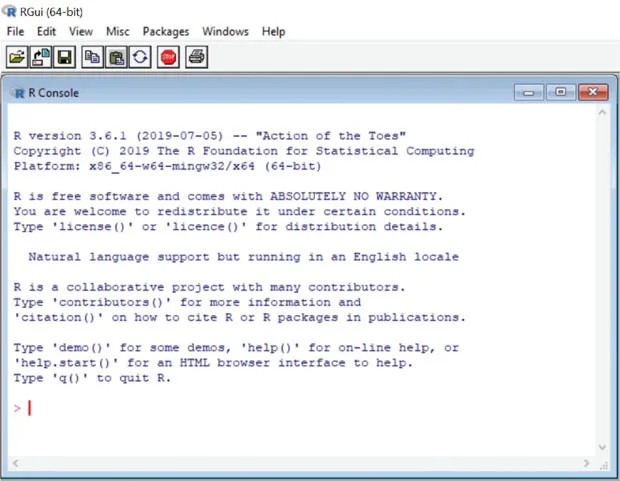
The basic version of R offers (even in MS Windows) a rather limited user interface. Basically, in various versions of the Linux system, there is almost no default interface, and operations in the program are carried out from the command line or by running the appropriate text files (scripts). This is because R is in fact a computational engine, while all forms of the user interface are an addition to facilitate communication with the program. This approach provides great flexibility in the preparation of calculations but requires more knowledge or programming skills. Figure 1.1 shows the basic R interface.
Figure 1.1 Basic interface of the R program (in MS Windows)
Source: Own study
The existence of various interfaces (other than the basic one in the MS Windows system) allows one to choose the form that will be the most convenient for the user. The features of several of the most popular interfaces (apart from the default interface for MS Windows) are briefly presented subsequently. The interface selection belongs to the user. It is worth noting, however, that the chosen interface gives complete freedom in editing the prepared R code and is not limited to providing basic operations on the principle of selecting from the menu.
1.2.1 R Commander
R Commander is one of the longest developed and most stable user interfaces for the R software. It is installed as a classic additional package and is available in standard R repositories. This interface does not require installation of additional external software. As the creators of this overlay indicate, it provides a “clickable” interface and allows for focusing more on calculations and searching for appropriate computational methods (available from the R Commander level) than on the preparation of the script that performs the R language. Even if one “clicks” instead of writing commands, the codes are still visible to the user. It should be emphasised that the use of R Commander – as the authors write themselves – allows analysis only in selected aspects (programmed in this overlay), providing access to only a small portion of the possibilities of the R package.3 The webpage of this interface is: http://www.rcommander.com, with the latest information and more details available on the website of the author of this project (John Fox): http://socserv.mcmaster.ca/jfox/Misc/Rcmdr/. On this website, one can also find detailed instructions (and other supporting materials, including sample screenshots) for R Commander package. R Commander is an overlay that is quite limiting in the use of the program – at least when it comes to choosing functions from the graphical menu. It should serve, rather, to make the first sketch of the script, which must be supplemented later in the case of more sophisticated calculations.
1.2.2. RStudio
RStudio (Open Source Edition) is an environment that is also available under the free license, as is R itself. It is currently the most advanced and strongly developed development environment for R, so one should consider using it. It is not a typical “clickable” interface and does not relieve the user but provides much better working comfort by facilitating manual programming of scripts in R while giving easier access to data description, the help system, a graphics window, a console with results and so on. RStudio, apart from the standard desktop version, has a server version enabling common work and sharing tasks. The website of the described environment (http://www.rstudio.com/products/rstudio/) contains more information about this software, help and the program itself to download. The creators of RStudio provided – apart from written materials – short videos showing the possibilities of this environment. Before starting to work in this environment, it is worth getting acquainted with the previously mentioned website and the information contained therein. Figure 1.2 presents RStudio when working. More screenshots are available on the program’s website.
A few useful remarks about RStudio:
The RStudio environment must be additionally installed – installation packages for various systems are available for download from the program’s website. One must first install R – otherwise, RStudio will not connect to it and will be useless. In the case of individual use, one should choose the Desktop version; for collaboration between many users, use the server version of RStudio.
For Linux-based systems, one needs to download the appropriate package – they are not always in the basic repositories of various distributions (e.g. in Ubuntu, the deb package from the program’s website installs without problems, and then one can update it after downloading the new version).
By starting RStudio, the R engine starts right away; it is not necessary to do it separately.
RStudio has a built-in script editor with syntax highlighting so one can easily build, load and save the work in a quite convenient way.
Other useful functions of RStudio are: it allows one to work directly in the console, shows a list and allows one to view already loaded or defined objects/data, facilitates access to the history of executed commands (although in pure R, this is also available) and their selective execution, has a dedicated part of the screen for graphs/graphics, facilitates the management of additional packages and integrates help to R. On the website http://www.rstudio.com/products/rstudio/features/ an interesting wider descripti...
Table of contents
Cover
Half Title
Series
Title
Copyright
Contents
List of figures
List of tables
List of contributors
Introduction
Statement by the American Statistical Association on statistical significance and p-value – use in the book
8 Spatial point pattern analysis and spatial interpolation
9 Spatial sampling and bootstrapping
10 Spatial big data
11 Spatial unsupervised learning – applications of market basket analysis in geomarketing
Appendix A: Datasets used in examples
Appendix B: Links between packages
References
Index
Frequently asked questions
Yes, you can cancel anytime from the Subscription tab in your account settings on the Perlego website. Your subscription will stay active until the end of your current billing period. Learn how to cancel your subscription
No, books cannot be downloaded as external files, such as PDFs, for use outside of Perlego. However, you can download books within the Perlego app for offline reading on mobile or tablet. Learn how to download books offline
Perlego offers two plans: Essential and Complete
Essential is ideal for learners and professionals who enjoy exploring a wide range of subjects. Access the Essential Library with 800,000+ trusted titles and best-sellers across business, personal growth, and the humanities. Includes unlimited reading time and Standard Read Aloud voice.
Complete: Perfect for advanced learners and researchers needing full, unrestricted access. Unlock 1.5M+ books across hundreds of subjects, including academic and specialized titles. The Complete Plan also includes advanced features like Premium Read Aloud and Research Assistant.
Both plans are available with monthly, semester, or annual billing cycles.
We are an online textbook subscription service, where you can get access to an entire online library for less than the price of a single book per month. With over 1.5 million books across 990+ topics, we’ve got you covered! Learn about our mission
Look out for the read-aloud symbol on your next book to see if you can listen to it. The read-aloud tool reads text aloud for you, highlighting the text as it is being read. You can pause it, speed it up and slow it down. Learn more about Read Aloud
Yes! You can use the Perlego app on both iOS and Android devices to read anytime, anywhere — even offline. Perfect for commutes or when you’re on the go. Please note we cannot support devices running on iOS 13 and Android 7 or earlier. Learn more about using the app
Yes, you can access Applied Spatial Statistics and Econometrics by Katarzyna Kopczewska in PDF and/or ePUB format, as well as other popular books in Economics & Business General. We have over 1.5 million books available in our catalogue for you to explore.