With recent advances in computing power and the widespread availability of preference, perception and choice data, such as public opinion surveys and legislative voting, the empirical estimation of spatial models using scaling and ideal point estimation methods has never been more accessible.The second edition of Analyzing Spatial Models of Choice and Judgment demonstrates how to estimate and interpret spatial models with a variety of methods using the open-source programming language R.
Requiring only basic knowledge of R, the book enables social science researchers to apply the methods to their own data. Also suitable for experienced methodologists, it presents the latest methods for modeling the distances between points.
The authors explain the basic theory behind empirical spatial models, then illustrate the estimation technique behind implementing each method, exploring the advantages and limitations while providing visualizations to understand the results.
This second edition updates and expands the methods and software discussed in the first edition, including new coverage of methods for ordinal data and anchoring vignettes in surveys, as well as an entire chapter dedicated to Bayesian methods. The second edition is made easier to use by the inclusion of an R package, which provides all data and functions used in the book.
David A. Armstrong II is Canada Research Chair in Political Methodology and Associate Professor of Political Science at Western University. His research interests include measurement, Democracy and state repressive action.
Ryan Bakker is Reader in Comparative Politics at the University of Essex. His research interests include applied Bayesian modeling, measurement, Western European politics, and EU politics.
Royce Carroll is Professor in Comparative Politics at the University of Essex. His research focuses on measurement of ideology and the comparative politics of legislatures and political parties.
Christopher Hare is Assistant Professor in Political Science at the University of California, Davis. His research focuses on ideology and voting behavior in US politics, political polarization, and measurement.
Keith T. Poole is Philip H. Alston Jr. Distinguished Professor of Political Science at the University of Georgia. His research interests include methodology, US political-economic history, economic growth and entrepreneurship.
Howard Rosenthal is Professor of Politics at NYU and Roger Williams Straus Professor of Social Sciences, Emeritus, at Princeton. Rosenthal's research focuses on political economy, American politics and methodology.
Trusted by 375,005 students
Access to over 1.5 million titles for a fair monthly price.
The purpose of this book is to give a comprehensive introduction to estimating spatial (geometric) models from political choice data with R (Team, 2018). These models are geometric in that they use the relative positions of points in an abstract space to represent data that can be interpreted as distances (also known as relational data). We will use the term “geometric model” interchangeably with “spatial model” throughout this book. The reason is that the term “spatial” is also used in the field of spatial statistics to refer to the analysis of physically proximate units. Unfortunately, this has caused some confusion because the word “spatial” is used for both classes of models.
The aim of a spatial model is to produce a geometric representation or spatial map of some quantity. For example, a spreadsheet that tabulates all the distances between pairs of sizable cities in France contains the same information as the corresponding map of France, but the spreadsheet gives you no idea what France looks like.* Embedded within the distance data is the information necessary to construct a map, and the goal of scaling methods is to recover this spatial map. Though a spatial map contains essentially the same information as the table of inter-city distances, the spatial map provides a more readily interpretable visual representation of patterns in the data (Tufte, 1983).
In the above example, the dimensionality—understood as “the number of separate and interesting sources of variation among the objects”(Jacoby, 1991, p. 27)—of the data is known a priori. That is, we know in advance the number (two) and meaning (north-south and east-west) of the dimensions needed to represent geometrically the inter-city distances data. However, this is not always the case. For instance, we may only have suspicions about the number and meaning of the dimensions necessary to model a data set of legislative roll call votes (in which legislators vote Yea or Nay or abstain on a series of policy proposals). In this case, spatial models can discover as well as present patterns in the data.
In political science, spatial models are also used to measure latent (unobservable) quantities from observed indicators. For instance, we might measure a voter’s level of conservatism (i.e., her position on an ideological dimension) using a series of survey questions about her issue positions. This type of information can be used to address a range of important questions in political science: the level of polarization in legislatures and electorates (McCarty, Poole and Rosenthal, 2006; Ansolabehere, Rodden and Snyder, 2006; Shor and McCarty, 2011), the ideological makeup of campaign contributors (Bon-ica, 2013), and the quality of representation of voter preferences (Gerber and Lewis, 2004; Bafumi and Herron, 2010).
________________________
*See, for example, Jordan Ellenberg, “Growing Apart: The Mathematical Evidence for Congress’ Growing Polarization,” Slate Magazine, 26 December 2001, available from http://www.slate.com/articles/life/do_the_math/2001/12/growing_apart.html for an application of the analogy between spatial and geographic maps to contemporary American politics.
We deal with a broad class of spatial (geometric) models in this book because what is loosely called “spatial models” is actually a collection of theory and estimation methods developed in the fields of psychology, economics, and political science (see Poole, 2017). In psychology, various methods of multidimensional scaling (MDS) have been developed during the past fifty years to analyze similarity and preferential choice data. For example, a set of respondents are asked to judge how similar various colors are to each other (e.g., Ekman 1954). MDS methods model these similarities as distances between points representing the colors in a geometric space. MDS techniques are designed to produce a spatial map that summarizes a large set of data graphically, where the axes of the graph represent the latent, organizing dimensions that account for variation in the data (e.g., light to dark, poor to rich, or liberal to conservative). The research literature has shown that geometric models are not only convenient ways of representing simple patterns in a stream of data but also, (indeed, because this is the case), are good models of how humans process information and make decisions (see, e.g., Hare and Poole (2014a)).
1.1 The Spatial Theory of Voting
Economists, psychologists and political scientists all contributed to the development of the spatial theory of voting, which states that political preferences can be represented in abstract space and that individuals vote for the candidate or policy alternative closest to them. In this regard, a spatial map is literally a visual representation of where voters and candidates are to be found in a low-dimensional (ideological) space. A spatial map shows locations in a space defined by, for example, a left-right or liberal-conservative dimension. Although Hotelling (1929) and Smithies (1941) are credited with originating the idea, it was the publication of Anthony Downs’s An Economic Theory of Democracy in 1957 that really established spatial theory as a conceptual tool. Hotelling studied the logic of the location of a grocery store in a “linear” town—that is, a town strung out along a highway, where all the houses face a single road. In Hotelling’s famous model, the optimum location for a grocery store is the median of the town (the median minimizes the sum of the walking distances to the store). Hotelling (1929, p. 54) noted the relevance of this result to the political world as he saw it:
The competition for votes between the Republican and Democratic parties does not lead to a clear drawing of issues, an adoption of two strongly contrasted positions between which the voter may choose. Instead, each party strives to make its platform as much like the other’s as possible. Any radical departure would lose many votes, even though it might lead to stronger commendation of the party by some who would vote for it anyhow. Each candidate “pussyfoots,” replies ambiguously to questions, refuses to take a definite stand in any controversy for fear of losing votes.
Downs took the Hotelling-Smithies model of spatial competition of stores and applied it to the competition between political parties. He assumed that voters were distributed over a choice dimension—for example, the level of government spending on military defense—and that political parties played the role of the stores. For example, a right-wing, militaristic party would be near one end of the spectrum, while a left-wing, pacifistic party would be on the opposite end. If voters vote for the party closest to them on the dimension, the parties will converge to the median ideal point. Duncan Black (1948; 1958) had earlier derived the median voter theorem for voting in committees.†
In the spatial theory of voting, voters are assumed to have ideal points that mark their most preferred outcome. For example, a voter whose ideal point is for the government to allocate 10% of the budget to military spending will receive the most utility if this policy is adopted. Voters also have utility functions across the range of policy alternatives—in this case, from 0% to 100% of the budget allocated to national defense—that specify the amount of utility voters obtain from each outcome. Utility functions are assumed to be single-peaked (that is, highest at the voter’s ideal point) and symmetric (monotonically decreasing in the distance from the ideal point) (Enelow and Hinich, 1984).
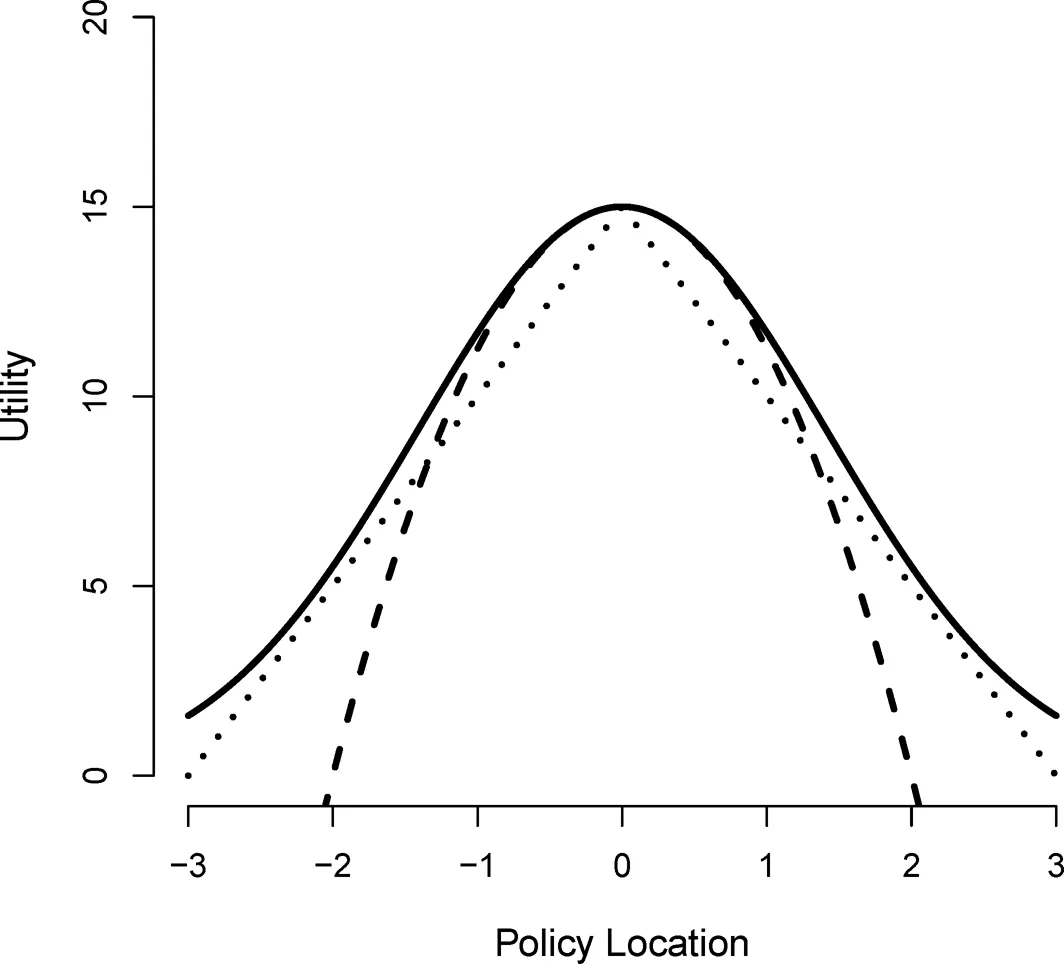
Figure 1.1 shows three commonly used utility functions in spatial voting models: the quadratic form, the normal (Gaussian) form, and the linear (ab-solute distance) form.‡ Each functional form satisfies the criteria of single-peakedness and symmetry: individuals (in this case, a voter whose ideal point or most preferred outcome is at “0”) gain the most utility when the outcome is at their ideal point, and grow increasingly dissatisfied as the proposal moves away from their ideal point. Historically, the quadratic and linear forms were most commonly used, in large part because they are analytically simpler and more computationally tractable than the normal form (for a voter with ideal point 0 and policy x, the equation for the linear form is: y = -|x| + a and the quadratic form is simply: y = -x2 + a, where a is an arbitrary constant). The quadratic form is more commonly used than the linear form because it is differentiable at the ideal point and because, in models involving uncertainty, it permits a mean variance decomposition. The quadratic form is also attractive in modeling risk-averseness, since losses in utility accelerate as the policy moves away from the voter’s ideal point. However, recent work by Carroll et al. (2013) demonstrates that legislators’ utility functions are better approximated by the normal (Gaussian) functional form. The normal form is also attractive because it captures the phenomenon of alienation from indifference (Riker and Ordeshook, 1973, pp. 324-330). That is, when two policy alternatives are very distant from a voter’s ideal point, the voter will be nearly indifferent between the two options.
________________________
†Black’s median voter theorem is central not just to spatial voting models, but the development of the discipline of political science in general. William Riker (1990b, p. 178) writes that it was “certainly the greatest step forward in political theory in this century.”
‡The quadratic is also known as parabolic, the normal as bell-shaped, and the linear as tent.
FIGURE 1.1: Gaussian (solid line), Quadratic (dashed line) and Linear (dotted line) Utility Functions for Voter with Ideal Point of 0
1.1.1 Theoretical Development and Applications of the Spatial Voting Model
The work of Downs and Black led to a surge of theoretical work on spatial models of voting in mass elections and in legislatures. In the decades that followed, formal work blossomed involving the spatial theory of voting. Much of this work involves advances made in the field of social choice theory, which is concerned with the aggregation of individual choices (Davis, Hinich and Ordeshook, 1970). Spatial modeling has produced a number of insights into the role of instability in processes of preference aggregation (see Shepsle (2010, chaps. 3-7) for a thorough exposition of this subject). Scholars have long been aware (since at least Marquis de Condorcet’s development of Condorcet’s paradox in the late-eighteenth century) that even if individuals hold complete and transitive preferences over a set of three or more alternatives, cycles may nonetheless be present in their aggregated preference order. That is, a majority of voters may prefer candidate A over candidate B, candidate B over candidate C, but also candidate C over candidate A.
In his seminal work Social Choice and Individual Values, Arrow (1951) developed his famous impossibility theorem, which showed that the Condorcet paradox applies to any reasonable method of preference aggregation. More formally, Arrow’s impossibility theorem states that the possibility of cycles in the ordering of group preferences is present in any aggregation method that satisfies a set of minimal conditions, often referred to as CUPID: complete and transitive individual preferences, Pareto optimality, independence of irrelevant alternatives, and non-dictatorship.
The result has been obviously troubling for democratic theorists since it rules out the certainty of stable majority rule. Theoretical hopes for stability were partially salvaged by two later works. First, Black (1958) demonstrated that majority rule is guaranteed to produce a stable outcome (at the location of the median voter) if preferences are single-peaked and ordered along a single dimension. Plott (1967) generalized this result to multidimensional space on the very specific condition that ideal points are radially symmetric around the multidimensional equivalent of the median voter. However, McKelvey (1976, 1979) dealt a lethal blow to such hopes with his chaos theorem (see also Schofield 1978). McKelvey’s chaos theorem shows that Black’s result does not generalize when the policy space is multidimensional and ideal points lack a radially symmetric distribution. In this case, which describes virtually all multidimensional policy spaces, there is an absence of a stable equilibrium.
One implication of this finding is that losers in a single-dimensional situation have an incentive to raise new, advantageous dimensions to upset the exis...
Table of contents
Cover
Half Title
Title Page
Copyright Page
Table of Contents
Preface
Author Biographies
1 Introduction
2 Analyzing Issue Scales
3 Analyzing Similarities and Dissimilarities Data
4 Unfolding Analysis of Rating Scale Data
5 Unfolding Analysis of Binary Choice Data
6 Bayesian Scaling Models
References
Index
Frequently asked questions
Yes, you can cancel anytime from the Subscription tab in your account settings on the Perlego website. Your subscription will stay active until the end of your current billing period. Learn how to cancel your subscription
No, books cannot be downloaded as external files, such as PDFs, for use outside of Perlego. However, you can download books within the Perlego app for offline reading on mobile or tablet. Learn how to download books offline
Perlego offers two plans: Essential and Complete
Essential is ideal for learners and professionals who enjoy exploring a wide range of subjects. Access the Essential Library with 800,000+ trusted titles and best-sellers across business, personal growth, and the humanities. Includes unlimited reading time and Standard Read Aloud voice.
Complete: Perfect for advanced learners and researchers needing full, unrestricted access. Unlock 1.5M+ books across hundreds of subjects, including academic and specialized titles. The Complete Plan also includes advanced features like Premium Read Aloud and Research Assistant.
Both plans are available with monthly, semester, or annual billing cycles.
We are an online textbook subscription service, where you can get access to an entire online library for less than the price of a single book per month. With over 1.5 million books across 990+ topics, we’ve got you covered! Learn about our mission
Look out for the read-aloud symbol on your next book to see if you can listen to it. The read-aloud tool reads text aloud for you, highlighting the text as it is being read. You can pause it, speed it up and slow it down. Learn more about Read Aloud
Yes! You can use the Perlego app on both iOS and Android devices to read anytime, anywhere — even offline. Perfect for commutes or when you’re on the go. Please note we cannot support devices running on iOS 13 and Android 7 or earlier. Learn more about using the app
Yes, you can access Analyzing Spatial Models of Choice and Judgment by David A. Armstrong,Ryan Bakker,Royce Carroll,Christopher Hare,Keith T. Poole,Howard Rosenthal in PDF and/or ePUB format, as well as other popular books in Social Sciences & Computer Science General. We have over 1.5 million books available in our catalogue for you to explore.