![]()
SECTION 1
Introduction to the Interpretation of the Electrocardiogram
The first and most important step in ECG interpretation is the differentiation between “normal” and “abnormal.”
The second step consists of differentiation between the various abnormal ECG patterns and their correlation with known pathologic conditions. In particular, the recent discoveries with small, subtle, significant markers for adverse events such as early repolarization, Brugada-type ECGs, and other channelopathies.
Information about the ECG in disease is much more complex than knowledge of normal variation. Yet, it is in the differentiation between normal and abnormal that difficulties in ECG interpretation frequently arise.
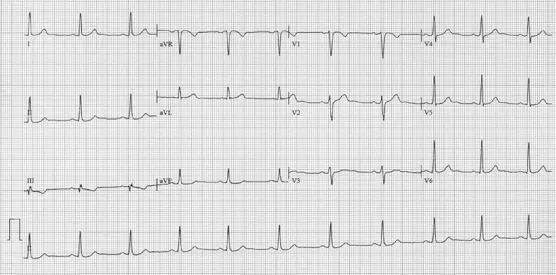
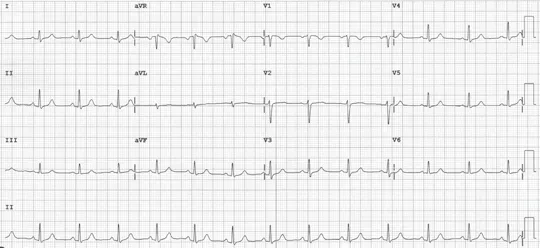
Below are two examples of normal ECGs.
Heart rate: 64 bpm
PR interval: 154 ms
QRS duration: 98 ms
QT/QTc: 406/415 ms
Normal ST-T wave patterns
Heart rate: 80 bpm
PR interval: 148 ms
QRS duration: 92 ms
QT/QTc: 364/420 ms
It is important to have a systematic approach when analyzing and interpreting of ECGs.
1. Baseline findings in sinus rhythm.
2. Observations during tachycardias.
3. Analysis of the changes of the cardiographic morphologies (transient changes).
4. Mode of spontaneous initiation and termination.
5. Maneuvers during tachycardias.
In a stepwise approach to ECG or rhythm analysis, one should determine the rate of the tachycardia (fast or slow), the QRS duration (wide or narrow) and morphology, and the relationship of the P wave to the QRS, whether it is before, during, or after, and if there is a one-to-one relationship between the P wave and the QRS.
Other important points regarding interpretation of the ECG.
1. Determine the origin and initiation of cardiac arrhythmias.
2. Look for myocardial ischemia and infarction.
3. Evidence of electrolyte imbalance and reversible causes.
4. Systemic and myocardial disorders.
5. Measure; do not eyeball the intervals.
6. Focus on the zone of transition.
References
1. Wellens HJ, Gorgels AP. The electrocardiogram 102 years after Einthoven. Circulation. 2004;109(5):562–564.
2. Yong CM, Froelicher V, Wagner G. The electrocardiogram at a crossroads. Circulation. 2013;128(1):79–82.
3. Stern S. Electrocardiogram: Still the cardiologist’s best friend. Circulation. 2006;113(19):e753–e756.
![]()
SECTION 2
Conduction Disturbances: Sinus Node Disease/Sick Sinus Syndrome, AV Conduction Disturbances, AV Blocks,
Bundle Branch Blocks, and Fascicular Blocks
Mohammad-Ali Jazayeri, MD
Mohammad-Reza Jazayeri, MD
CASE
2.1
Patient History
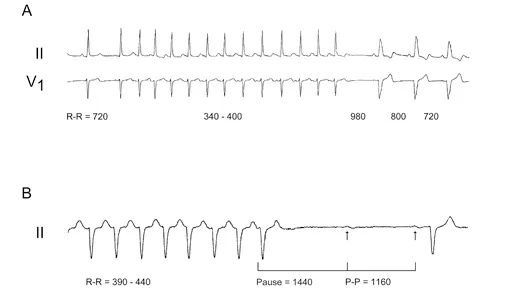
Two cases are shown in Figure 2.1.1. The first is from a 68-year-old female with severe aortic stenosis who underwent aortic replacement three days prior to the date that the rhythm strip (Panel A) was obtained. Her surgery was uneventful, and her native valve was replaced with a 21-mm Medtronic Mosaic tissue valve. The second case is an 84-year-old male with a 10-day history of recurrent syncope who was admitted to the hospital.
Figure 2.1.1 The occurrence of block after termination of supraventricular tachycardia (SVT). Panel A shows a non-sustained run of narrow QRS complex atrial tachycardia (AT) followed by sinus beats exhibiting left bundle branch block (LBBB). Panel B depicts termination of a wide QRS complex AT followed by a 1440-ms pause and then a blocked sinus beat. The subsequent sinus beat is conducted with first-degree atrioventricular (AV) block (PR interval of 300 ms) and a QRS complex similar to that during AT. All of the intervals are in ms. The paper speed is different in these two panels.
The rhythm strip (Panel B) was obtained from the patient one day after admission.
Question
What is the probable mechanism of block in Figure 2.1.1A and B?
1. Pause-dependent block
2. His-Purkinje system (HPS) fatigue phenomenon
3. Functional block in the HPS
4. Potent vagal stimulation
Answer
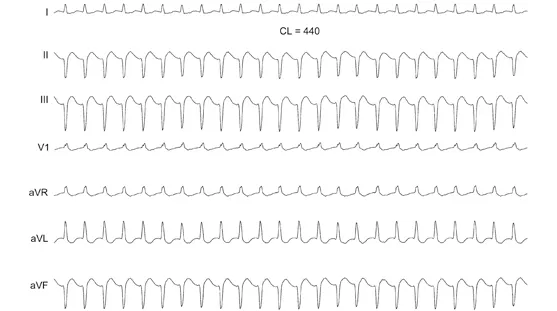
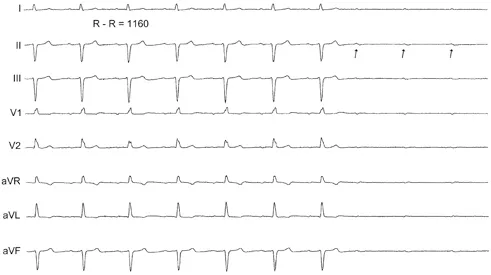
The correct answer is A. The common theme in these two cases is the termination of a run of supraventricular tachycardia (SVT), followed by a pause before the arrival of the next sinus (P wave) beat. Subsequently, the P wave is conducted with LBBB in panel A and bilateral BBB in panel B. In other words, the occurrence of block is preceded by a sudden short-to-long input to the AV conduction system. It should be mentioned that the SVT, in both cases, is most likely AT with narrow QRS complex in Case 1; and with RBBB and left anterior fascicular block (LAFB) (bifascicular block) in Case 2 (Figure 2.1.2). Case 2 suddenly developed third-degree AV block later during the same hospital course (Figure 2.1.3).
Figure 2.1.2 Sustained AT. Seven-lead ECG of a sustained episode of AT with a cycle length (CL) of 440 ms is shown. The QRS complex is 120 ms with RBBB and LAFB present.
Figure 2.1.3 Spontaneous third-degree AV block...