Local people can generate their own numbers and the statistics that result are powerful for themselves and can influence policy. Development practitioners are supporting and facilitating participatory statistics from community-level planning right up to sector and national-level policy processes. Statistics are being generated in the design, monitoring and evaluation, and impact assessment of development interventions.Through describing policy, programme and project research, Who Counts? provides impetus for a step change in the adoption and mainstreaming of participatory statistics within international development practice. The challenge laid down is to foster institutional change on the back of the methodological breakthroughs and philosophical commitment described in this book. The prize is a win–win outcome in which statistics are a part of an empowering process for local people and part of a real-time information flow for those aid agencies and government departments willing to generate statistics in new ways.
eBook - ePub
Who Counts?
About this book
Trusted by 375,005 students
Access to over 1.5 million titles for a fair monthly price.
Study more efficiently using our study tools.
Information
Chapter 1 – Introduction. Participatory statistics: a ‘win–win’ for international development
The practice and potential of participatory statistics in development research
Participatory statistics have gained a methodological foothold in the pluralistic world of development research. In recent years participatory research has established its credentials as an approach – with an accompanying set of tools – in which local people themselves generate statistics. Since the early 1990s there has been a ‘quiet tide of innovation’ (Chambers, 2008) in generating statistics using participatory methods, with diverse examples of cutting-edge and transformative participatory research that can be plotted in the NE quadrant of Figure 1.1. This tide has captured methodological innovation at all levels and in all spheres of development activity. Development practitioners are supporting and facilitating participatory statistics from community-level planning right up to sector- and national-level policy processes. Statistics are being generated in the design, monitoring and evaluation, and impact assessment of policies, programmes, and projects.
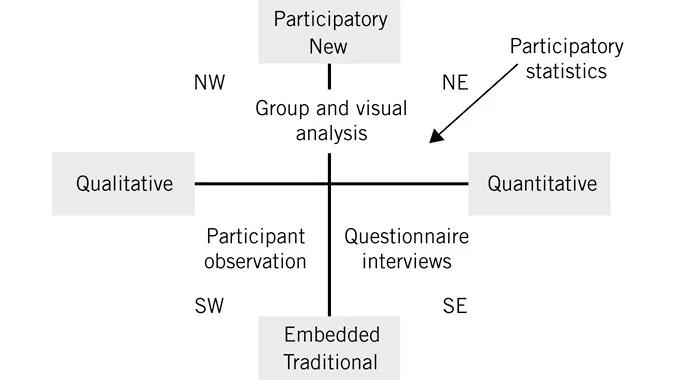
Figure 1.1 Dimensions of methodology and outcome. Source: adapted from Chambers, 2008
Reflecting on this accumulation of experience, this book suggests that a wider and more systematic use of participatory statistics would benefit both development agencies and local communities. The book makes the following claims for a ‘win–win’ perspective on participatory statistics:
• Participatory research can generate accurate and generalizable statistics in a timely, efficient (value for money), and effective way; and
• Participatory statistics empower local people in a sphere of research that has traditionally been highly extractive and externally controlled.
This book seeks to provide impetus for a step change in the adoption and mainstreaming of participatory statistics within international development practice. There is a wonderful opportunity for donors, partners, and development practitioners to reflect jointly on what an institutionalized approach to participatory statistics might look like and to agree a radical agenda for action. The challenge here is to foster institutional change on the back of the methodological breakthroughs and philosophical commitment described in this book. The prize is a ‘win–win’ outcome in which statistics are a part of an empowering process for local people and part of a real-time information flow for those aid agencies and government departments willing to generate statistics in new ways.
Participatory research is different from ‘conventional’ research
Participatory statistics are generated within a ‘paradigm’ of participatory research. This paradigm has long challenged a ‘top-down’ approach to knowledge generation that institutionalizes control of knowledge amongst powerful development professionals. Participatory approaches reposition ownership and control by asking ‘whose reality counts?’ (Chambers, 1997) and ‘who counts reality?’ (Estrella and Gaventa, 1998). In this way, participatory research respects local knowledge and facilitates local ownership and control of data generation and analysis.
In contrast to the individualized observation and discussions in much top-down investigation, participatory research also focuses on public and collective reflection and action. At its most political, participatory research is a process in which reflection is internalized and promotes raised political consciousness. In this way, population involvement in research shifts from passive to active. Participatory research supports empowerment by providing opportunities for local agency and shifting power dynamics in aid and development relationships (Eyben, 2006).
Participatory statistics come in many forms
Local people generate statistics in many ways, through mapping, measuring, estimating, valuing, and comparing, and combinations of these (Chambers, 2008, see Box 1.1). They do so through open-ended group-based data generation and analysis, accompanied by in-depth diagnostic or evaluative discussion. This is in contrast with conventional survey-based research, which is typically one-on-one and collects simple pieces of data using questionnaires with closed-ended questions (Barahona and Levy, 2003: 9). Crucially, when participatory numbers are compiled or aggregated, for example from a series of focus group discussions, they can be subjected to statistical analysis.
Box 1.1 Participatory methods that generate numbers
Methods often used to generate numbers include:
• participatory mapping (ActionAid-Nepal, 1992; Chambers, 1997; Barahona and Levy, 2003)
• participatory modelling (Rambaldi and Callosa-Tarr, 2000, 2002)
• proportional piling (Watson, 1994; Jayakaran, 2002, 2003, 2007; Sharp, 2005: 20–4)
• card writing, marking, sorting, ordering, and positioning (Kagugube et al., 2007)
• matrix ranking and scoring (Abeyasekera, 2001; Abebe et al., 2008)
• pair-wise ranking (Mukherjee, 2001)
• linkage diagramming (Burn, 2000; Galpin et al., 2000)
• pocket voting (van Wijk, 2001).
Source: Chambers, 2008: 111
Powerful examples of counting are social and census maps (see, for example, Figure 1.2). Conducted in group mode, social mapping generates very accurate data in contexts where there is ‘community owned’ (public) knowledge, for example when listing and categorizing households in small rural communities. Through a process of ‘group-visual synergy’ (Chambers, 2008: 99), participants can ‘see what is being said’ and correct and add detail. For community census purposes, the outcomes have proven very accurate, and where there have been discrepancies, community analysts have wanted to check until they reach agreement.
An example of calculating comes from Community-Led Total Sanitation (CLTS), where as part of an appraisal process, local people worked out the quantities (e.g. cartloads for the whole community) of shit (the crude word is used) produced by their households in a day, multiplied out for longer periods, and added up for the whole community, concluding sometimes with community cartloads per annum (Kar, 2008).
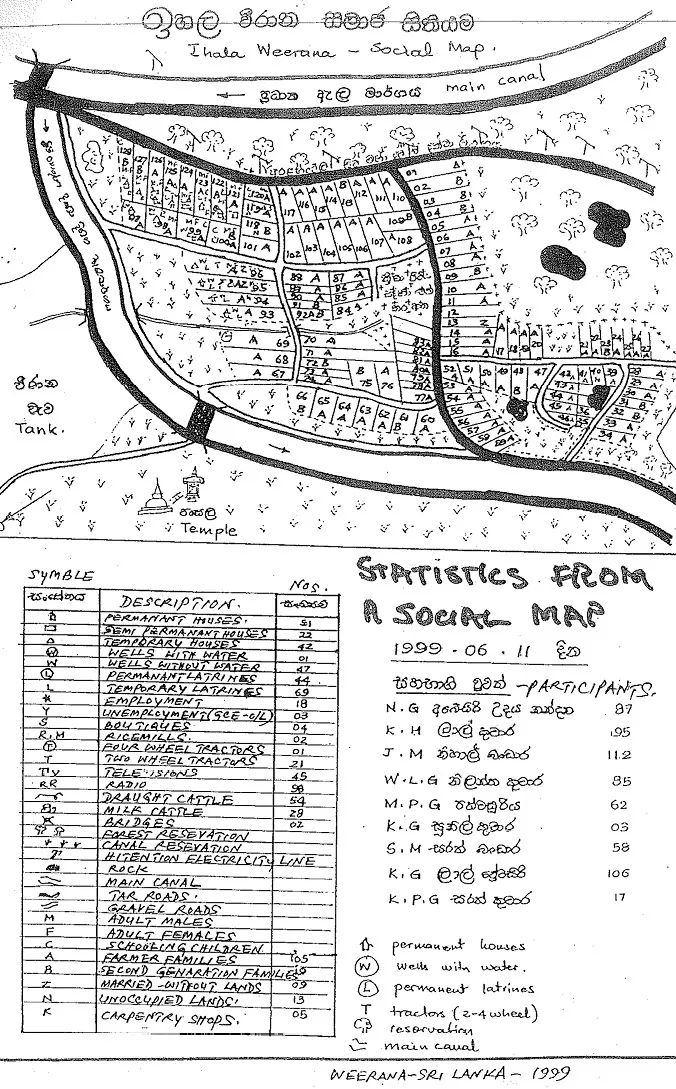
Figure 1.2 A social map
Examples of participatory measuring can be found in natural resource management and planning, including the use of participatory GIS modelling (e.g. Rambaldi et al., 2007). Through group-based analysis, local people measure natural resources and map and model land use. Examples of participatory measuring can be found with timber stocks, water flows, crop yields, arm circumferences, and land-use areas from participatory GIS mapping and modelling.
Participatory estimating uses comparative and relative proportions to indicate trends and changes, for example in production or consumption resources. Historical matrices (e.g. Freudenberger, 1995; PRAXIS, 2001) indicate trends and changes, while seasonal food calendars show seasonal variations in things like amount and type of food consumed (e.g. Mukherjee and Jena, 2001) and health problems (Shah, 1999). Proportional piling has been widely used to estimate income and food sources (e.g. Watson, 1994; Eldridge, 2001). There are many applications with variants of methods such as the Ten Seed Technique (Jayakaran, 2002) or the allocation of 100 seeds, stones, or other counters to give percentages. At the time of writing, this technique was being used in a DFID-funded, six-country impact assessment of cash benefit transfers on beneficiary household income and expenditure patterns. The research was using ‘cluster sampling’ to generate participatory statistics for over 10 per cent of the beneficiaries in each sampled community. During the fieldwork, beneficiaries conducted individual income and expenditure analysis and then participated in group analytical discussion to validate, explain, and interpret the data generated.
Valuing and scoring methods allow local analysts to categorize and place a value on qualitative dimensions of their social, economic, and political lives. Examples of valuing and scoring methods are preference ranking, matrix ranking, and matrix scoring (Jones, 1996). Things valued include problems with water supply management in China (Vernooy et al., 2003), police–youth relations in Jamaica (Holland et al., 2007), household spending priorities in Maharashtra, India (Kapadia-Kundu and Dyalchand, 2007), crop varieties in Zambia (Drinkwater, 1993) and India (Manoharan et al., 1993) to contraceptive methods in Bangladesh (Kar and Datta, 1998). They range from girls’ preferences for sex-partners in Zambia (Shah, 1999) to local preferences for wild plants collected for winter feeding of goats in Afghanistan (Leyland, 1994).
Comparing is widely used in participatory research and is often a significant part of the activities summarized above. Comparisons are made in many ways, often directly through the statistics. Numbers or scores can also be generated as a second stage of a physical activity of grouping or positioning, in many instances with cards representing households. Perhaps the best-known and most widespread example is wealth or well-being ranking, where analysts group households according to their judgements of personal or household conditions. This method has been in use for over 20 years by NGOs and INGOs (see, for example, RRA Notes 15, 1992, for an introduction). Plan International and ActionAid, for example, have for many years used wealth ranking as standard practice when first engaging with a community. Placing on a scale is another. In Uganda small groups have placed household cards on a rope symbolizing climbing out of poverty, with the best condition at one end, and the worst at the other, leading to scores between 0 and 10. This method was included as a participatory module in a sub-sample of the Uganda National Household Survey, with major differences emerging between income findings from the UNHS questionnaire and ‘having enough money’ in the qualitative module (Kagugube et al., 2007). Wealth ranking was conducted as part of the participatory Consultations with the Poor on Safety Nets study in Malawi, which fed into the classification of poor households for a poverty-targeting impact assessment in Malawi (see Barahona, Chapter 10). Through participatory studies of urban violence during the past two decades, urban residents in Jamaica and Latin America have estimated the frequency of different types of violence and ranked them according to their seriousness alongside the importance, positive and negative, of different institutions. These have been aggregated to show patterns and compare priorities across communities (see, for example, Moser and McIlwaine, 2004).
Participatory research can measure qualitative changes in processes and relationships
Building on the principle of valuing introduced above, participatory methods are increasingly being used to generate data that quantifies the qualitative (as above) and then measures qualitative changes. Development agencies recognize the importance of measuring changes in processes and relationships, such as empowerment, governance, and accountability. However, donor and government agencies are more used to measuring observable outcomes – metrics such as household income or school attendance. Measuring changing relationships – some of which are linked to these observable outcomes – enables donors and governments to understand their contribution to complex change processes and (predicted and unpredicted) outcomes. Recent and ongoing donor efforts to measure and track qualitative changes have focused on empowerment (see, for example, Alsop et al., 2006) and on voice and accountability (see, for example, Holland and Thirkell, 2009).
Scoring of qualitative changes in relationships, generated through participatory processes, creates space and legitimacy in project monitoring frameworks for these difficult-to-measure changes, while opening the door to in-depth participatory diagnostic analysis. More generally, the use of quantification can be very effective in opening up policy space for discussing non-monetary impacts and linking this discussion to a broader policy debate that incorporates process issues of governance, empowerment, social inclusion, and so on. Recent examples within DFID’s portfolio of programmes include methodological innovations with participatory research in a huge global initiative to empower adolescent girls and flagship civil society strengthening programmes in Burma, Afghanistan and Vietnam.
A lot of the innovation and credibility with ‘qualitative indicators’ has come through the emergence of standardized and aggregated governance indicators for regional or global benchmarking – such as the Afrobarometer indicators, the Ibrahim Index of African Governance, and the World Bank’s Worldwide Governance Indicators. The Afrobarometer, for example, includes indicators based on recall data (e.g. ‘in the past year, how many times have you paid a bribe to an official for service X?’) and on perception scoring of qualitative relationships (e.g. on a scale of 1–4, how much do you trust your local service provider?).1
At community level in different contexts, scorecards have emerged as powerful tools for quantifying and monitoring service provider performance. At the interface of ‘rights holders’ and ‘duty bearers’, participatory statistics serve as powerful tools for oversight, advocacy, and accountability. Emerging fro...
Table of contents
- Cover
- Title
- Contents
- Acronyms and abbreviations
- Acknowledgements
- Chapter 1 – Introduction. Participatory statistics: a ‘win–win’ for international development
- PART I: Participatory statistics and policy change
- Part II: Who counts reality? Participatory statistics in monitoring and evaluation
- PART III: Statistics for participatory impact assessment
Frequently asked questions
Yes, you can cancel anytime from the Subscription tab in your account settings on the Perlego website. Your subscription will stay active until the end of your current billing period. Learn how to cancel your subscription
No, books cannot be downloaded as external files, such as PDFs, for use outside of Perlego. However, you can download books within the Perlego app for offline reading on mobile or tablet. Learn how to download books offline
We are an online textbook subscription service, where you can get access to an entire online library for less than the price of a single book per month. With over 1.5 million books across 990+ topics, we’ve got you covered! Learn about our mission
Look out for the read-aloud symbol on your next book to see if you can listen to it. The read-aloud tool reads text aloud for you, highlighting the text as it is being read. You can pause it, speed it up and slow it down. Learn more about Read Aloud
Yes! You can use the Perlego app on both iOS and Android devices to read anytime, anywhere — even offline. Perfect for commutes or when you’re on the go.
Please note we cannot support devices running on iOS 13 and Android 7 or earlier. Learn more about using the app
Please note we cannot support devices running on iOS 13 and Android 7 or earlier. Learn more about using the app
Yes, you can access Who Counts? by Jeremy Holland in PDF and/or ePUB format, as well as other popular books in Social Sciences & Global Development Studies. We have over 1.5 million books available in our catalogue for you to explore.