eBook - ePub
Community Resources for Older Adults
Programs and Services in an Era of Change
- 616 pages
- English
- ePUB (mobile friendly)
- Available on iOS & Android
eBook - ePub
Community Resources for Older Adults
Programs and Services in an Era of Change
About this book
Community Resources for Older Adults provides comprehensive, up-to-date information on programs, services, and policies pertaining to older adults. Authors Robbyn R. Wacker and Karen A. Roberto build reader awareness of programs and discuss how to better understand help-seeking behavior, as well as explain ways to take advantage of the resources available to older adults. The substantially revised Fifth Edition includes new topics and updated research, tables, and figures to help answer key questions about the evolution and utilization of programs for older adults and the challenges that service providers face.
Trusted by 375,005 students
Access to over 1.5 million titles for a fair monthly price.
Study more efficiently using our study tools.
Information
Part I The Social Context of Community Resource Delivery
Chapter 1 On the Threshold of a New Era
What will society in the United States be like in the year 2030? It is hard to know exactly how different our daily lives will be, but we do know that by 2030, our society will be experiencing something that none other has experienced. As we move through the 21st century, more Americans than ever before will be in their seventh, eighth, and ninth decades of life. Between 2011 and 2030, about 10,000 baby boomers will turn 65 each day (Cohn & Taylor, 2010). By 2030, the first members of the baby boom generation, born in 1946, will be 84 years of age, and the youngest members, born in 1964, will be 65. By 2030, there will be about 74 million people age 65 and older—more than twice the number in 2000 (Federal Interagency Forum on Aging-Related Statistics, 2016). Demographically, the baby boom cohort is sandwiched between two smaller cohorts. As a result of its enormous size and vast racial and ethnic diversity, it has commanded attention at every stage of its life course. In the 1960s, school systems were forced to react to the soaring enrollments of the baby boom cohort; soon, social institutions that serve the older population will be challenged to respond to the baby boomers as well.
Will this graying of our population dramatically change our society? As demographers, economists, gerontologists, sociologists, and others debate this question, we can be relatively safe in predicting that, because of their unique characteristics, the aging baby boomers will cause a reexamination of current aging policies and services. Unlike the generations before them, collectively, they will be better educated, better off financially, living in the suburbs, and beneficiaries of the programs and services that were put in place for their grandparents. On the other hand, this giant cohort is tremendously diverse. About 84% of boomers have completed high school and 27% have a bachelor’s degree or more (U.S. Census Bureau, 2015b). Although boomers’ earnings are comparable to their parents’ at a similar stage in life, the distribution of wealth in the United States has become more unequal in the past two decades; it is projected that 2% of boomers will live in poverty and 5% will live in near-poverty (up to 125% of the poverty line) in 2030 (K. Smith, 2003). Race and ethnicity are related to poverty in late life. In 2015, 6.6% of White elders lived below the poverty level, compared with 18.4% of Black elders, 11.8% of Asian elders, and 17.5% of Hispanic elders (Administration on Aging [AoA], 2017).
A Supplemental Poverty Measure (SPM) released by the U.S. Census Bureau in 2011 provides additional information about the economic profile of older Americans. In contrast to the official poverty rate, the SPM takes into account regional variations in cost of living, the impact of noncash benefits received (e.g., food stamps, low-income tax credits), and nondiscretionary expenditures including out-of-pocket medical costs. Using this measure, the number of older people living in poverty is significantly higher than the official poverty line indicates—14% versus 10% of all individuals 65 and older (Federal Interagency Forum on Aging-Related Statistics, 2016). While not replacing the official poverty measure, the SPM sheds light on the effect of social safety net programs and the marked impact of out-of-pocket medical expenses for older adults, raising awareness about how many older individuals are hovering dangerously close to poverty at any point in time (Tavernise & Gebeloff, 2011). In the coming decades, high rates of near-poverty and poverty will no doubt have implications for the financial well-being and quality of life of persons of all races and ethnicities in later life.
Another unique characteristic of the boomer cohort is their marriage and family patterns as compared with those of their parents and grandparents. Boomers tended to marry later, have smaller families, and have higher rates of divorce than their parents. In 2009, one in three boomers (aged 45 to 63 years) was unmarried (31% men; 37% women; Lin & Brown, 2012). This was a 50% increase in the number of unmarried individuals as compared with the same age cohort in 1980. Approximately 58% of these unmarried boomers were divorced, 32% were never married, and 10% were widowed (Lin & Brown, 2012). There is a greater tendency to never marry among younger boomers (born 1959–1964): 16.7% of men and 11.4% of women have never married, compared with 7.5% of men and 7.1% of women who make up the older boomer population (born 1946–1951; MetLife Mature Market Institute, 2010a, 2010b). These unmarried boomers are changing the economic and social landscape of late life—they have a poverty rate almost five times higher than among married boomers; more than three times the number of unmarried boomers rely on public assistance (e.g., food stamps, SSI) than do married boomers; and unmarried boomers report twice the disability rate of married boomers, but are less likely to have health insurance coverage (Lin & Brown, 2012).
Boomers also are redefining the traditional definition of “family” and thereby increasing the complexity of kin networks. Boomer families take many forms, including single-parent families, stepfamilies, cohabiting heterosexual and same-gender couples, childless families, intergenerational families, and transnational families (Roberto & Blieszner, 2015). Because families play a key role in providing instrumental and emotional support, as well as long-term care, to their older members, it is uncertain how these changes will influence family support patterns. Compared with their parents’ generation, boomers are less likely to have a spouse to rely on and will have fewer adult children to serve as caregivers (L. H. Ryan, Smith, Antonucci, & Jackson, 2012). Thus, will adult children feel an obligation to care for both biological and stepparents? Will families who choose not to have children be at risk of having fewer informal resources? Will friends and families of choice be acknowledged and accepted as important sources of support and caregivers for lesbian, gay, bisexual, and transgender elders? Although the exact influence of family composition changes on the use of formal services is not known, we can anticipate that community programs and services will play a significant role in the lives of all older adults.
Collectively, these demographic characteristics will shape the type, amount, and nature of community resources in the future. They will increase the demand for home health care and retirement housing options. Many baby boomers will move into third, fourth, and even fifth careers and seek educational opportunities and greater flexibility in work and retirement options. The social safety net may need to be expanded for the underclass and lower class. The sheer numbers of aged boomers will challenge policy makers to rethink health care, retirement programs, and pension plans. Even now, projections—both dire and not so dire—are being made about Social Security and Medicare. Thus, demographic characteristics of the next generation of older adults will have direct implications on social policies that, in turn, support programs and services for older adults. In the next section, we discuss a few more of the salient demographic characteristics of the boomer cohort and the current populations of older adults.
Growth of the Older Population
In 1950, 12.3 million persons (8.2% of the population) living in the United States were age 65 and older. By 2016, the number of persons age 65 and older had grown to 49.2 million (15.2% of the population; U.S. Census Bureau, 2017). The older population will continue to grow rapidly over the next few decades as approximately 10,000 baby boomers turn 65 every day, a trend that started in 2011 and will not end until 2030. The number of older adults is expected to reach 74.1 million (20.6% of the population) by 2030 and 98.1 million (23.6% of the population) by 2060 (Exhibit 1.1) (U.S. Census Bureau, 2014). Members of the older population are also aging. In 2010, 21.7 million persons were between the ages of 65 and 74, 13.1 million persons constituted the 75-to-84 age-group, and 5.4 million people were 85 years of age and older, including more than 53,400 people 100 years of age and over (L. A. West, Cole, Goodkind, & He, 2014). Moreover, persons 85 years of age and older represent the fastest-growing segment of the older adult population. The number of persons age 85 and older is expected to grow to 9.1 million in 2030 and reach 19 million by 2050 (U.S. Census Bureau, 2014).
While growth in the aging population will be seen across the United States, some states and regions will be more dramatically affected than others. In 2015, more than half of persons age 65 and older lived in 10 states: California, Florida, Illinois, Michigan, North Carolina, New Jersey, New York, Ohio, Pennsylvania, and Texas (AoA, 2017). Almost 80% of persons 65 and older lived in metropolitan areas, with 27% of these older adults living in principal cities (AoA, 2016). However, older adults also account for a larger proportion of the U.S. population living in nonmetropolitan rural areas than any other age-group (Rural Health Information Hub, 2017), with 18.6% of older adults living in rural areas. This relatively large proportion of older adults residing in rural communities has stimulated concern among some policy makers and human services providers about their access to affordable housing, transportation, general and specialized health providers, and social services (Goins & Krout, 2006).
States and regions of the country are seeing dramatic growth in their population proportion of older adults due to migration patterns. Over the past few decades, some Southern and Western regions have seen an increase in the older population because they have become popular retirement destinations, while some states in the Midwest and Northeast have seen a higher concentration of older adults largely due to out-migration of younger workers while older residents remained (L. A. West et al., 2014). Between 2005 and 2015, five states saw their 65 and older population increase by 50% or more: Alaska (63%), Nevada (55%), Colorado (54%), Georgia (50%), and South Carolina (50%; AoA, 2017). The geographic distribution of the older White population is similar to the geographic distribution of the total older population (L. A. West et al., 2014). However, among other racial and ethnic groups, the regional distribution is more skewed. For example, about 55% of Black older adults reside in the South compared with 9% who live in the West. Nearly 80% of American Indian and Alaska Native older persons live in the West, as do about 57% of Asian older adults. Hispanic older adults are more likely to live in the South (39.6%) and West (38.7%) than in other regions of the United States.
Exhibit 1.1 Actual and Projected Growth of the Population Aged 65+ (in thousands): 2015 to 2060
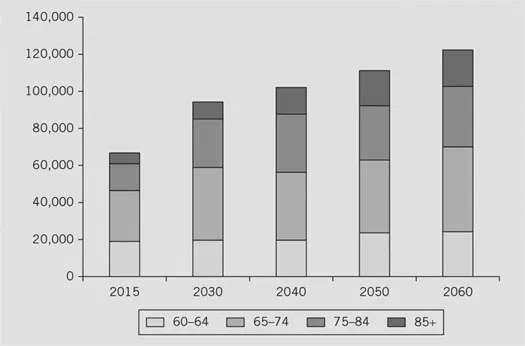
Source: Data from U.S. Census Bureau (2014).
What are the social implications of such an increase in the older adult population? Many writers in the popular press suggest that the increase in the number of older adults signals an impending social and fiscal crisis (Debate.org, 2017) and that aged persons will become a financial burden to society (e.g., Samuelson, 2005; Thompson, 2012). Others argue that a “crisis mentality” overlooks other important demographic factors (e.g., Nikolova, 2016; Singer, 2011). Although it is true that the United States, along with other developed nations, will experience an increase in the older adult population, the number of older adults has steadily increased during the past 130 years. This steady increase has allowed society to adapt to the changes of an aging population and provided new opportunities for scientific and business innovation and growth. Many scholars believe society will be able to adapt to this new cohort of older adults as well (J. H. Schulz & Binstock, 2006).
The assumption that older adults will place a burden on society is often based on the economic dependency ratio, which is the ratio of persons in the total population (including those in the armed forces overseas and children) who are not in the labor force per 100 of those who are in the labor force. In 2014, persons not in the labor force included 42 persons under the age of 16, 38 persons ages 16 to 64, and 24 persons 65 years of age or older per 100 workers (Toossi, 2015). The part of the economic dependency ratio that has been steadily increasing is the portion attributable to older persons, and with the aging of the baby boomers, the dependency ratio of the 65+ group is expected to increase to 30 by 2024.
The increase in the number of older adults, however, does not automatically result in a greater social burden. The aging population presents serious challenges, as well as major opportunities, for all sectors of society. Meeting these challenges and seizing opportunities will require a new vision of American life that reaches beyond the immediate challenge of the aging of the boomers and promotes active engagement and a high quality of life throughout the lifecourse (MacArthur Foundation Research Network on an Aging Society, 2008).
Growth of the Older Population of Racial and Ethnic Minorities
With the aging of the baby boomers, the older population is growing more diverse. Approximately 14% of baby boomers are from racial and ethnic minority groups: 8.7% are Black, 4.0% are Asian alone, and 1.3% represent all other races alone or in comb...
Table of contents
- Cover
- Half Title
- Acknowledgements
- Title Page
- Copyright Page
- Brief Contents
- Detailed Contents
- The Authors’ Purpose
- Acknowledgments
- Part I The Social Context of Community Resource Delivery
- Chapter 1 On the Threshold of a New Era
- Chapter 2 Legislative Foundations for Programs, Services, and Benefits Supporting Older Adults
- Chapter 3 Patterns of Service Use and Theories of Help-Seeking Behavior
- Part II The Continuum of Services
- Chapter 4 Information and Assistance
- Chapter 5 Volunteer and Intergenerational Programs
- Chapter 6 Education Programs
- Chapter 7 Senior Centers and Recreation
- Chapter 8 Employment Programs
- Chapter 9 Income Programs
- Chapter 10 Nutrition and Meal Programs
- Chapter 11 Health Care and Wellness
- Chapter 12 Mental Health Services
- Chapter 13 Legal Services
- Chapter 14 Transportation
- Chapter 15 Housing
- Chapter 16 Caregiver Support Services
- Chapter 17 Care Management
- Chapter 18 Home Care Services
- Chapter 19 Long-Term Care Services
- Part III Preparing for the Future
- Chapter 20 Programs and Services in an Era of Change
- References
- Index
- About the Authors
Frequently asked questions
Yes, you can cancel anytime from the Subscription tab in your account settings on the Perlego website. Your subscription will stay active until the end of your current billing period. Learn how to cancel your subscription
No, books cannot be downloaded as external files, such as PDFs, for use outside of Perlego. However, you can download books within the Perlego app for offline reading on mobile or tablet. Learn how to download books offline
Perlego offers two plans: Essential and Complete
- Essential is ideal for learners and professionals who enjoy exploring a wide range of subjects. Access the Essential Library with 800,000+ trusted titles and best-sellers across business, personal growth, and the humanities. Includes unlimited reading time and Standard Read Aloud voice.
- Complete: Perfect for advanced learners and researchers needing full, unrestricted access. Unlock 1.5M+ books across hundreds of subjects, including academic and specialized titles. The Complete Plan also includes advanced features like Premium Read Aloud and Research Assistant.
We are an online textbook subscription service, where you can get access to an entire online library for less than the price of a single book per month. With over 1.5 million books across 990+ topics, we’ve got you covered! Learn about our mission
Look out for the read-aloud symbol on your next book to see if you can listen to it. The read-aloud tool reads text aloud for you, highlighting the text as it is being read. You can pause it, speed it up and slow it down. Learn more about Read Aloud
Yes! You can use the Perlego app on both iOS and Android devices to read anytime, anywhere — even offline. Perfect for commutes or when you’re on the go.
Please note we cannot support devices running on iOS 13 and Android 7 or earlier. Learn more about using the app
Please note we cannot support devices running on iOS 13 and Android 7 or earlier. Learn more about using the app
Yes, you can access Community Resources for Older Adults by Robbyn R. Wacker,Karen A. Roberto in PDF and/or ePUB format, as well as other popular books in Social Sciences & Gerontology. We have over 1.5 million books available in our catalogue for you to explore.