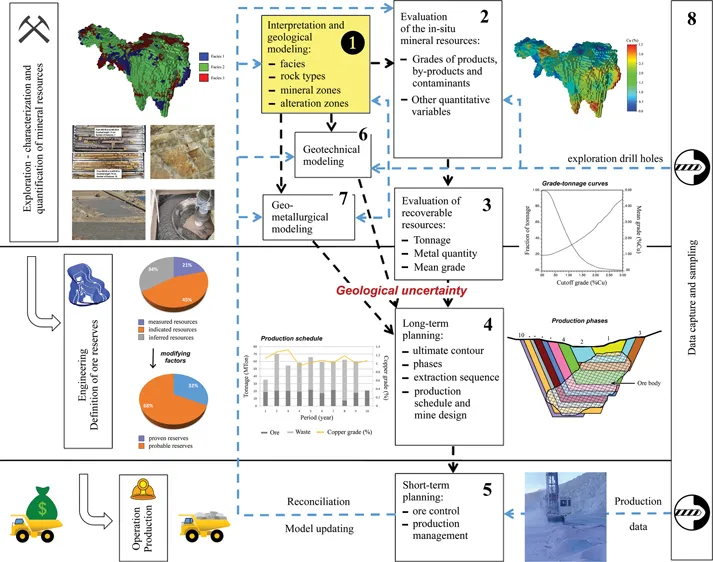
This book covers the main mining issues where geostatistics, a discipline founded in the 1960s to study regionalized variables measured at a limited number of points in space, is expected to play a role. Each chapter of the book is associated with a stage of the mining sequence, including the interpretation and geological modeling of mineral deposits, evaluation of in-situ and recoverable resources, long-term mine planning, short-term planning and ore control, geotechnics, geometallurgy and sampling.
This work, featuring more than 150 illustrations, avoids the traditional laborious and crippling theoretical treatment of geostatistics and is systematically oriented toward a practical exhibition of the problems and proposed solutions. The writing is fluid and intended to involve the reader. The book is the fruit of more than 35 cumulative years of applied research by the authors, a professor at the University of Chile and a researcher at Mines ParisTech, carried out in collaboration with the Chilean company Codelco since the late 1990s.
Despite focusing on copper porphyry deposits, the generalization of the methods presented to the entire mining industry is straightforward. The broad range of problems addressed, including generally neglected disciplines such as geotechnics, geometallurgy and sampling, and their practical presentation make this book unique and usable by a very wide audience – students, researchers, geologists, engineers, geotechnicians and metallurgists.
Trusted by 375,005 students
Access to over 1.5 million titles for a fair monthly price.
Three applications of geostatistics to geological modeling are presented. The first one refers to a simple geometry and calls into question the use or not of geostatistics. The diatreme pipe at the El Teniente mine is a chimney-like structure filled with weakly mineralized breccias, with an approximately conic shape. It can be represented by a group of measurements set to 1 (one) immersed in an infinite field of 0 (zero) that indicates its absence. In this context, is it acceptable to apply the geostatistical formalism of random fields, which always relies, in one way or another, on a form of stationarity that assumes that statistical properties such as the mean, the variance or the variogram are invariant by a translation in space?
The second and third applications focus on the modeling of mineralized breccias and of the surrounding facies, a characteristic of porphyry copper deposits. These deposits constitute the main resource of copper and molybdenum worldwide. They are often associated with porphyritic rocks that can be distinguished by the presence of feldspar phenocrystals embedded in a fine matrix. Etymologically, porphyra means ‘purple’, in reference to the best-known red variety of these rocks. Here, the challenge is to reproduce the existing natural transitions when moving from one facies to another, the way in which the rock types intermingle in space.
1.1 The ‘Braden pipe’ of El Teniente
El Teniente is the largest porphyry copper deposit in the world and is located in the Rancagua region of central Chile, about 70 km southeast of Santiago. Mining started in 1905, and the deposit is currently exploited from underground by panel caving (Hustrulid and Bullock, 2001) with more than 3,000 km of galleries.
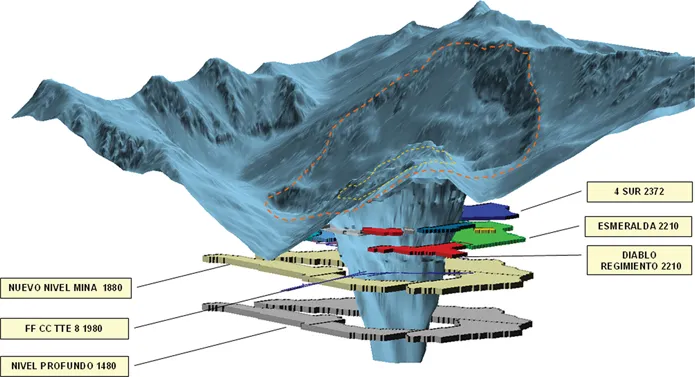
The deposit is also famous among geologists for its diatreme, a weakly mineralized intrusion with the shape of an inverted vertical cone of 1 km height and a maximum diameter of 1 km at its highest point (Skewes et al., 2002; Maksaev et al., 2004). Known as the ‘Braden pipe’ or ‘Braden breccia’ by Chilean geologists and miners, this unit crosses the deposit and constitutes the internal limit of the mining operations (Figure 1.1). It is important to determine the surface of its contour. This problem refers to the geometry and precedes the prediction of copper grade, which is often conditioned by the defined geometry, as will be seen later.
Figure 1.1 The topography of the surface and diatreme (Braden pipe) of El Teniente mine. The labels identify the levels mined since the 1940s and those of the future. After more than one hundred years of exploitation, the top of the diatreme now appears in satellite views. (Credit: Felipe Celhay.)
About 4,500 drill holes crossing the pipe from side to side with different orientations are available, each of which has been split into composite samples of 6 m length. The resulting 90,000 samples are coded by 0 (outside the diatreme) or by 1 (inside). Several approaches have been tested to predict the contour of the pipe:
2D approach: For each drill hole, only the elevation of the transition, either from 0 to 1 or from 1 to 0, is recorded. The regionalized variable is then the elevation of the points on the surface of the diatreme, studied in a traditional way (variogram analysis and then ordinary kriging).
Binary approach (3D): The indicator function of the diatreme (with values 0 or 1) is directly studied in the three-dimensional space by applying the usual techniques of stationary geostatistics.
Intermediate approach (3D): The regionalized variable can take the values 0, 1, and 0.5.
Let us detail this third approach. The kriging of a binary random field produces values that are generally included in the interval [0,1], and the question is to know from which value one considers to be inside the object, insofar as the geologists are interested in the coordinates of the surface rather than in a pseudoprobability. In order to answer this question, consider a point in space exactly halfway between two samples coded as 1 and 0, respectively. Because nothing in the model specifies any link between the distance between samples and their values (0 or 1), the midpoint of the two samples will be, on average, on the desired surface. An ordinary kriging at such a midpoint will assign the same weighted ½ to each of the two samples, yielding a prediction equal to 0.5. Accordingly, the value 0.5 constitutes the probability threshold above which it is judicious to consider to be inside the diatreme. The improvement introduced by the third ‘intermediate’ approach consists in assigning the value 0.5 to the points of the 2D approach that are previously identified as on or close to the surface of the diatreme. The regionalized variable is no longer binary but now has three states: 0, 0.5, and 1.
For each data set, a variogram model is inferred and ordinary kriging is executed. The three approaches are evaluated by cross-validation (prediction of known data values, which are temporarily masked for the exercise) and compared with the work completed twenty years ago by Codelco-El Teniente geologist Felipe Celhay, a Mines ParisTech graduate and coauthor of the publication of the original study (Séguret and Celhay, 2013), who used the same measurements described here, proceeding level by level at a time when geomodeling software did not exist.
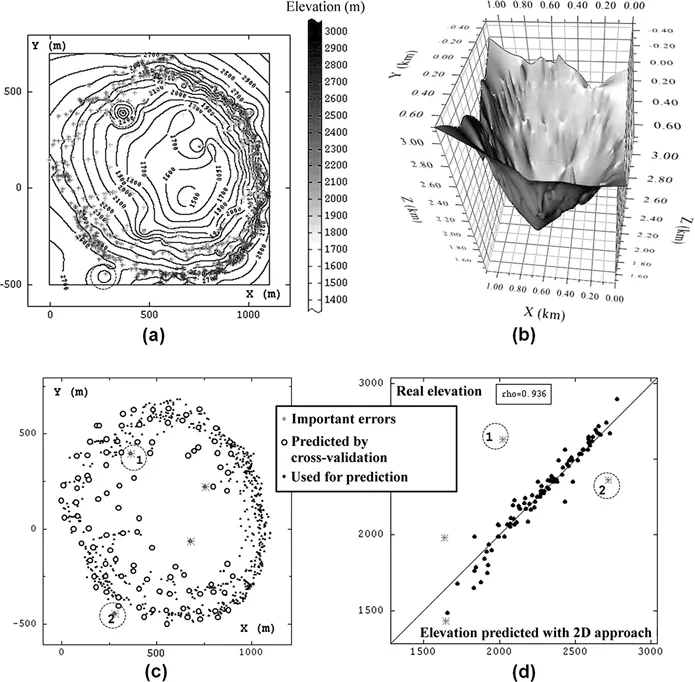
Let us analyze the results. For the 2D approach that uses about 1,000 points identified around the surface of the diatreme, some inconsistencies appear (Figure 1.2c and d), such as point n°1 for which the elevation is significantly underestimated. Why? This point is located at an elevation of more than 2,500 m, on the surface, in contact with the air. The transformation to 2D projects it toward the center of the map, in a place where most of the measurements touch a deeper surface whose elevation is obviously less, in the order of 2,000 m. Kriging favors these neighboring measurements and assigns them a significant weight because of their proximity, as nothing in the model indicates that the point targeted for prediction is not of the same nature as its neighbors. In the end, the predicted elevation is too low. This is the price to pay for the simplification that reduces the dimension of the problem. When moving toward the center of the figure, the measurements are supposed to decrease.
Figure 1.2 2D approach. The predicted diatreme surface represented in (a) isopleths or (b) a vertical development; (c) in light gray the points predicted by cross-validation using the remaining data points; (d) cross-diagram between the prediction (horizontal axis) and the true value (vertical axis). Points n°1 and 2 are discussed in the text.
The same analysis can be done for point n°2, whose elevation is overestimated, in this case because the point is located in the margin of the data crown where essentially high elevations are found. This marginal point is found in a deep protuburence of the diatreme.
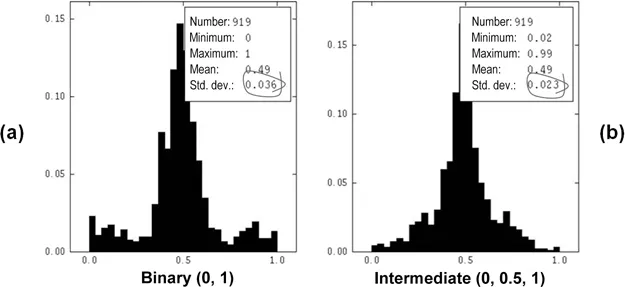
For the binary and intermediate approaches, the experimental verification by cross-validation concerns the points of the 2D approach for which kriging is expected to produce 0.5 on average, which is easily observed in the histograms of Figure 1.3: the predictions are centered on this value. Their quality is measured by the standard deviation around the value 0.5. In the intermediate approach, this standard deviation is divided by a factor of almost 2 because, near the surface, there are many data points whose values have been set to 0.5. Their proximity to the point targeted for prediction gives them significant kriging weights.
Figure 1.3 Comparison of approaches (1 of 2). (a) Histogram of the predictions at the edge of the diatreme surface using the values 0 and 1 of the binary approach; (b) histogram of the predictions at the same locations using the values 0, 0.5 and 1 of the intermediate approach.
The 0.5 isopleth curves in Figure 1.4a show how these points set to 0.5 ‘attract’ the curve of the intermediate approach. The comparison of the different curves with the geologists’ mapping (Figure 1.4b and c) is striking because of the good agreement of the different approaches. The explanation is given in Figure 1.4d, which represents a horizontal section of the result of kriging the indicator data, interpreted as (an estimate of) the probability of being inside the diatreme. In the vicinity of the surface, the thickness of the probability interval [0.25,1] is, on average, about 40 m, a low value in comparison with the dimensions of the diatreme. The sampling information is so ab...
Table of contents
Cover
Half Title
Title Page
Copyright Page
Dedication
Table of Contents
Acknowledgments
A bit of history
Introduction
1 Geometry and geology
2 Geology and grades
3 Grades and recoverable resources
4 Long-term planning and reserves
5 Short-term mine planning
6 Geotechnics
7 Recovery and geometallurgy
8 Sampling and geostatistics
9 Conclusions and perspectives
Appendix: Concepts and practices
References
Index
Frequently asked questions
Yes, you can cancel anytime from the Subscription tab in your account settings on the Perlego website. Your subscription will stay active until the end of your current billing period. Learn how to cancel your subscription
No, books cannot be downloaded as external files, such as PDFs, for use outside of Perlego. However, you can download books within the Perlego app for offline reading on mobile or tablet. Learn how to download books offline
We are an online textbook subscription service, where you can get access to an entire online library for less than the price of a single book per month. With over 1.5 million books across 990+ topics, we’ve got you covered! Learn about our mission
Look out for the read-aloud symbol on your next book to see if you can listen to it. The read-aloud tool reads text aloud for you, highlighting the text as it is being read. You can pause it, speed it up and slow it down. Learn more about Read Aloud
Yes! You can use the Perlego app on both iOS and Android devices to read anytime, anywhere — even offline. Perfect for commutes or when you’re on the go. Please note we cannot support devices running on iOS 13 and Android 7 or earlier. Learn more about using the app
Yes, you can access Geostatistics for the Mining Industry by Xavier Emery,Serge Antoine Séguret in PDF and/or ePUB format, as well as other popular books in Technology & Engineering & Applied Mathematics. We have over 1.5 million books available in our catalogue for you to explore.