This is a concise, easy to use, step-by-step guide for applied researchers conducting exploratory factor analysis (EFA) using the open source software R.
In this book, Dr. Watkins systematically reviews each decision step in EFA with screen shots of R and RStudio code, and recommends evidence-based best practice procedures. This is an eminently applied, practical approach with few or no formulas and is aimed at readers with little to no mathematical background. Dr. Watkins maintains an accessible tone throughout and uses minimal jargon and formula to help facilitate grasp of the key issues users will face while applying EFA, along with how to implement, interpret, and report results. Copious scholarly references and quotations are included to support the reader in responding to editorial reviews.
This is a valuable resource for upper-level undergraduate and postgraduate students, as well as for more experienced researchers undertaking multivariate or structure equation modeling courses across the behavioral, medical, and social sciences.
Trusted by 375,005 students
Access to over 1.5 million titles for a fair monthly price.
The idea that unobservable phenomena underlie observed measurements is very old and pervasive. In fact, it may be a basic scientific principle (Hägglund, 2001). Philosophers and scientists such as Plato, Descartes, Bacon, Locke, Hume, Quetelet, Galton, Pearson, and Mill articulated these philosophical and mathematical foundations. However, it was Spearman (1904) who explicated a mathematical model of the relations between observed measures and latent or unmeasured variables (Mulaik, 1987).
Spearman (1904) described his mathematical model as a “‘correlational psychology’ for the purpose of positively determining all psychical tendencies, and in particular those which connect together the so-called ‘mental tests’ with psychical activities of greater generality and interest” (p. 205). That is, to analyze the correlations between mental tests in support of his theory of intelligence. Spearman posited a general intelligence (labeled g) that was responsible for the positive relationships (i.e., correlations) he found among mental tests. Given that this general intelligence could not account for the totality of the test intercorrelations, he assumed that a second factor specific to each test was also involved. “Thus was born Spearman’s ‘two-factor’ theory which supposed that the observed value of each variable could be accounted for by something common to all variables (the general, or common, factor) and the residual (the specific factor)” (Bartholomew, 1995, p. 212). Spearman also assumed that mental test scores were measured with some degree of error that could be approximated by the correlation of two repeated measurements (i.e., test-retest reliability).
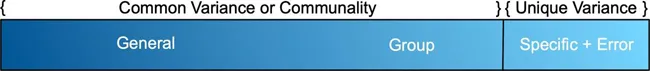
Exploratory factor analysis (EFA) methods were further debated and refined over the ensuing decades with seminal books appearing in the middle of the century (Burt, 1940; Cattell, 1952; Holzinger & Harman, 1941; Thomson, 1950; Thurstone, 1935, 1947; Vernon, 1961). These scholars found Spearman’s two-factor theory over simple and proposed group factors in addition to general and specific factors. Thus, the observed value of each variable could be accounted for by something common to all measured variables (general factor), plus something common to some but not all measured variables (group factors), plus something unique to each variable (specific factor), plus error. Common variance, or the sum of variance due to both general and group factors, is called communality. The combination of specific variance and error variance is called uniqueness (Watkins, 2017). As portrayed in Figure 1.1, this is the common factor model: total variance = common variance + unique variance (Reise et al., 2018).
Figure 1.1 Variance Components
The contributions of Thurstone (1931, 1935, 1940, 1947) were particularly important in the development of EFA. He studied intelligence or ability and applied factor analysis to many datasets and continued the basic assumption that “a variety of phenomena within the domain are related and that they are determined, at least in part, by a relatively small number of functional unities, or factors” (1940, p. 189). Thurstone believed that “a test score can be expressed, in first approximation, as a linear function of a number of factors” (1935, p. vii) rather than by general and specific factors. Thus, he analyzed the correlation matrix to find multiple common factors and separate them from specific factors and error. To do so, Thurstone developed factorial methods and formalized his ideas in terms of matrix algebra. Using this methodology, Thurstone identified seven intercorrelated factors that he named primary mental abilities. Eventually, he recognized that the correlations between these primary mental ability factors could also be factor analyzed and would produce a second-order general factor. Currently, a model with general, group, and specific factors that identifies a hierarchy of abilities ranging in breadth from general to broad to narrow is ascendant (Carroll, 1993).
A variety of books on factor analysis have been published. Some presented new methods or improved older methods (Cattell, 1978; Harman, 1976; Lawley & Maxwell, 1963). Others compiled the existing evidence on factor analysis and presented the results for researchers and methodologists (Child, 2006; Comrey & Lee, 1992; Fabrigar & Wegener, 2012; Finch, 2020a; Garson, 2013; Gorsuch, 1983; Kline, 1994; Mulaik, 2010; Osborne, 2014; Osborne & Banjanovic, 2016; Pett et al., 2003; Rummel, 1970; Thompson, 2004; Walkey & Welch, 2010). In addition, there has been a veritable explosion of book chapters and journal articles explicitly designed to present best practices in EFA (e.g., Bandalos, 2018; Beaujean, 2013; Benson & Nasser, 1998; Briggs & Cheek, 1986; Budaev, 2010; Carroll, 1985, 1995a; Comrey, 1988; Cudeck, 2000; DeVellis, 2017; Fabrigar et al., 1999; Ferrando & Lorenzo-Seva, 2018; Floyd & Widaman, 1995; Goldberg & Velicer, 2006; Hair et al., 2019; Hoelzle & Meyer, 2013; Lester & Bishop, 2000; Nunnally & Bernstein, 1994; Osborne et al., 2007; Preacher & MacCallum, 2003; Schmitt, 2011; Tabachnick & Fidell, 2019; Watkins, 2018; Widaman, 2012; Williams et al., 2010).
Conceptual Foundations
As previously noted, EFA is based on the concept that unobserved or latent variables underlie the variation of scores on observed or measured variables (Bollen, 2002). Alternative conceptualizations have been described by Epskamp et al. (2018). A correlation coefficient between two variables might exist due to: (a) a random relationship between those two variables, (b) one variable causing the other, or (c) some third variable being the common cause of both. Relying on the third possibility, EFA assumes that the correlations (covariance) between observed variables can be explained by a smaller number of latent variables or factors (Mulaik, 2018). “A factor is an unobservable variable that influences more than one observed measure and which accounts for the correlations among these observed measures” (Brown, 2013, p. 257).
Theoretically, variable intercorrelations should be zero after the influence of the factors has been removed. This does not happen in reality because no model is perfect and a multitude of minor influences is present in practice. Nevertheless, it is the ideal. As described by Tinsley and Tinsley (1987), EFA “is an analytic technique that permits the reduction of a large number of interrelated variables to a smaller number of latent or hidden dimensions. The goal of factor analysis is to achieve parsimony by using the smallest number of explanatory concepts to explain the maximum amount of common variance in a correlation matrix” (p. 414).
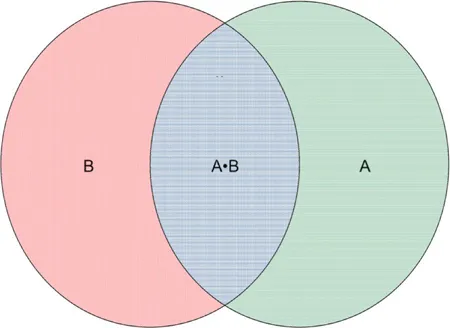
Figure 1.2 Correlation of Two Variables
The simplest illustration of common variance is the bivariate correlation (r) between two continuous variables represented by the circles labeled A and B in Figure 1.2. The correlation between variables A and B represents the percentage of variance they share, which is area A•B. The amount of overlap between two variables can be computed by squaring their correlation coefficient. Thus, if r = .50, then the two variables share 25% of their variance.
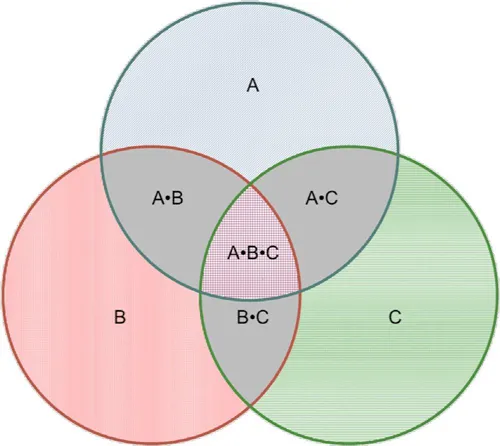
Figure 1.3 Correlation of Three Variables
With three variables, the shared variance of all three is represented by area A•B•C in Figure 1.3. This represents the general factor. The proportion of error variance is not portrayed in these illustrations but it could be estimated by 1 minus the reliability coefficient of the total ABC score.
EFA is one of a number of multivariate statistical methods. Other members of the multivariate “family” include multiple regression analysis, principal components analysis, confirmatory factor analysis, and structural equation modeling. In fact, EFA can be conceptualized as a multivariate multiple regression method where the factor serves as a predictor and the measured variables serve as criteria. EFA can be used for theory and instrument development as well as assessment of the construct validity of existing instruments (e.g., Benson, 1998; Briggs & Cheek, 1986; Carroll, 1993; Comrey, 1988; DeVellis, 2017; Haig, 2018; Messick, 1995; Peterson, 2017; Rummel, 1967; Thompson, 2004). For example, EFA was instrumental in the development of modern models of intelligence (Carroll, 1993) and personality (Cattell, 1946; Digman, 1990), and has been extensive applied for the assessment of evidence for the construct validity of numerous tests (Benson, 1998; Briggs & Cheek, 1986; Canivez et al., 2016; Watkins et al., 2002).
Readers should review the following statistical concepts to ensure that they possess the requisite knowledge for understanding EFA methods: reliability (internal consistency, alpha, test-rest, and alternate forms), true score (classical) test theory, validity (types of validity evidence), descriptive ...
Table of contents
Cover
Half Title
Title Page
Copyright Page
Contents
List of Figures
Preface
1 Introduction
2 Data
3 R and RStudio Software
4 Importing and Saving Data and Results
5 Decision Steps in Exploratory Factor Analysis
6 Step 1: Variables to Include
7 Step 2: Participants
8 Step 3: Data Screening
9 Step 4: Is Exploratory Factor Analysis Appropriate
16 Exploratory Factor Analysis with Categorical Variables
17 Higher-Order and Bifactor Models
18 Exploratory Versus Confirmatory Factor Analysis
Practice Exercises
References and Resources
Index
Frequently asked questions
Yes, you can cancel anytime from the Subscription tab in your account settings on the Perlego website. Your subscription will stay active until the end of your current billing period. Learn how to cancel your subscription
No, books cannot be downloaded as external files, such as PDFs, for use outside of Perlego. However, you can download books within the Perlego app for offline reading on mobile or tablet. Learn how to download books offline
Perlego offers two plans: Essential and Complete
Essential is ideal for learners and professionals who enjoy exploring a wide range of subjects. Access the Essential Library with 800,000+ trusted titles and best-sellers across business, personal growth, and the humanities. Includes unlimited reading time and Standard Read Aloud voice.
Complete: Perfect for advanced learners and researchers needing full, unrestricted access. Unlock 1.5M+ books across hundreds of subjects, including academic and specialized titles. The Complete Plan also includes advanced features like Premium Read Aloud and Research Assistant.
Both plans are available with monthly, semester, or annual billing cycles.
We are an online textbook subscription service, where you can get access to an entire online library for less than the price of a single book per month. With over 1.5 million books across 990+ topics, we’ve got you covered! Learn about our mission
Look out for the read-aloud symbol on your next book to see if you can listen to it. The read-aloud tool reads text aloud for you, highlighting the text as it is being read. You can pause it, speed it up and slow it down. Learn more about Read Aloud
Yes! You can use the Perlego app on both iOS and Android devices to read anytime, anywhere — even offline. Perfect for commutes or when you’re on the go. Please note we cannot support devices running on iOS 13 and Android 7 or earlier. Learn more about using the app
Yes, you can access A Step-by-Step Guide to Exploratory Factor Analysis with R and RStudio by Marley W. Watkins,Marley Watkins in PDF and/or ePUB format, as well as other popular books in Psychology & History & Theory in Psychology. We have over 1.5 million books available in our catalogue for you to explore.