Chapter 1 Power Loading and Wing Loading
Being a proficient pilot is more than just developing the necessary piloting skills. It also is having some appreciation of the major factors involved in aircraft design because these ultimately determine performance and handling qualities.
When an aircraft is conceived, its designer must mentally wrestle with a variety of variables. These include airframe weight, fuel capacity, range, payload, takeoff and landing speeds, cruise and climb performance, power, manufacturing cost, and operating economy.
Juggling these factors is a frustrating business because optimizing one almost always has a detrimental effect on another. Consequently, a designer must sacrifice certain elements to achieve a goal. The result invariably is a compromise between desire and pragmatism. Not one airplane performs, behaves, and handles the way its designer would have preferred. Creating an acceptable mix of variables is the designer’s art and probably is as much intuitive as scientific.
Before finalizing a specific configuration, a lightplane designer makes a performance forecast to verify that priorities have been satisfied. This is done by analyzing certain variables. The most significant of these include power loading, wing loading, aspect ratio, and wetted area.
The first item, power loading, helps determine if an airplane is underpowered or overpowered. Power loading is determined by dividing the maximum allowable takeoff weight by the total rated horsepower of all engines. (In the case of turbofans and turbojets, power loading is expressed as pounds of weight per pound of engine thrust.)
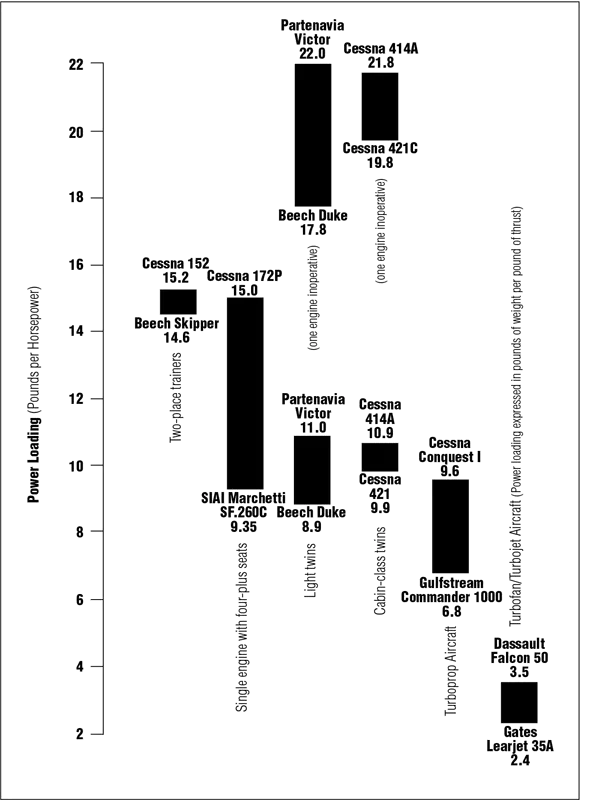
A Mooney 201, for instance, has a maximum gross weight of 2,740 pounds and is powered by a 200-hp engine. Its power loading, therefore, is 13.7 (pounds per horsepower). Figure 1 shows the range of power loadings for different classifications of general aviation airplanes.
Like other design variables, power loading seldom can be used in isolation to make valid performance predictions. Other factors need to be combined with it to obtain meaningful information. Generally, however, low power loading is associated with high performance.
Power loading can be used to determine initial takeoff acceleration. It is, after all, the inverse of the power-to-weight ratio used to calculate the acceleration of drag racers. Everything else being equal, the vehicle with the greatest power-to-weight ratio (or the lowest power loading) has the best acceleration.
Figure 1 shows that a Cessna 152, with a power loading of 15.2, has the highest power loading of the general aviation aircraft. Although it is no surprise that this aircraft has the poorest takeoff acceleration, this is not as negative a characteristic as it might appear. Because the 152 does not require a high liftoff speed, it does not necessarily need more takeoff distance than other singles do. The 36-hp Aeronca C-3 (known as the “Flying Bathtub”) had a power loading of 28 pounds per horsepower, but because it had to accelerate only to little more than jogging speed, takeoff distance was not excessive.
Figure 1. Ranges of power loading for various groupings of airplanes
Runway length requirements are determined by acceleration and by liftoff speed. If acceleration is constant, takeoff distance increases in proportion to the square of the liftoff speed. This means that every additional knot consumes more distance than the preceding knot. Stretching takeoff distance even farther is aircraft drag, which increases during the roll and reduces acceleration. This explains why manufacturers of STOL (short takeoff and landing) aircraft and modification kits rejoice with every knot that can be trimmed from the liftoff speed. A 5 percent speed reduction reduces takeoff distance by more than 10 percent.
Power loading also indicates how well (or how poorly) engine power can be relied upon to overcome aircraft inertia in flight. Everything else being equal, the airplane with the least power loading is best able to accelerate out of mushing flight and into a safe climb. This is perhaps best illustrated by referring to the power loadings of piston powered twin-engine airplanes.
Notice from Figure 1 that power loadings vary from 11 for a Partenavia Victor to 8.9 for a Beechcraft Duke. (This is a relatively narrow range, indicating that light-twin designs remain within established guidelines.) It is obvious that twins have a substantial power advantage when compared to singles. But look what happens to power loading when a twin loses half of its horsepower: Power loading doubles. It is apparent that the power loading of any twin with an inoperative piston engine exceeds that of a Cessna 152, which helps to explain why a crippled twin has such marginal performance.
Designers obviously prefer low power loadings but usually cannot justify the necessary sacrifices. Adding horsepower increases fuel consumption, inflates operating and manufacturing costs, and can decrease range and useful load. Power loading also can be improved by reducing gross weight, but this might require sacrificing fuel capacity, range, payload, and even airframe strength. Instead, the designer weighs priorities and makes the necessary compromises.
Although additional power substantially improves takeoff and climb performance, it does not increase cruise speed as much as one might expect (because drag increases in proportion to the square of the airspeed). For those who enjoy number crunching with a calculator, a rule of thumb states that cruise speed increases in approximate proportion to the cube root of the result obtained by dividing the horsepower of the new engine by the horsepower of the engine being replaced. For example, if a 300-hp aircraft with a 200-knot cruise were retrofitted with a 350-hp engine, the new speed would be approximately 211 knots. Although this 17 percent power boost results in only a 5 percent speed increase, takeoff and climb performance would improve dramatically.
Pilots should note that in operational practice, power loading is a variable. It decreases with a reduction of useful load and increases in proportion to the power loss (of naturally aspirated engines) associated with high density altitudes. This is just a fancy way of saying that aircraft performance varies with gross weight and available power.
One point of confusion to some is the difference between power and thrust. Power is the ability to perform work. One horsepower, by definition, is the power required to exert 550 pounds of force for a distance of 1 foot in one second. Thrust, however, is the force used to overcome drag and is measured in pounds.
Power and thrust are related by the following formula: Thrust = Horsepower x 260 ÷ Knots of True Airspeed (KTAS). (This formula assumes that the propeller converts horsepower into thrust with 80 percent efficiency, a crude average for lightplanes in cruise flight.)
For example, if an engine produces 215 hp at a time when the airplane is stabilized in cruise at 200 KTAS, the force of thrust is 280 pounds. Because thrust equals drag at such a time, the drag of this particular airplane at 200 knots also is 280 pounds. Engineers sometimes use this technique to estimate total airframe drag, and pilots can do the same. It is an interesting way to compare the aerodynamic cleanliness of one airplane with another (at a given density altitude).
Just as power loading indicates how heavily an engine is burdened by weight, wing loading indicates the extent to which a wing is burdened. Wing loading is calculated by dividing the maximum allowable takeoff weight by wing area. A Beech V35B Bonanza, for example, has a maximum takeoff weight of 3,400 pounds and a wing area of 181 square feet, resulting in a wing loading of 18.8 pounds per square foot. This result, however, is only an average because some areas of a wing lift more efficiently than others.
Confusing the issue somewhat is the definition of wing area, which includes more than the lifting surface. Wing area also includes the area between the wing roots (as outlined by extending the leading and trailing edges toward the airplane’s longitudinal axis) as well as those areas of the wing covered by engine nacelles (on most multiengine aircraft). These nonlifting areas are included in the calculation of wing area because of tradition and engineering convention. (An argument can be made to justify this definition of wing area because of the nature of the pressure distribution in the vicinity of a wing.)
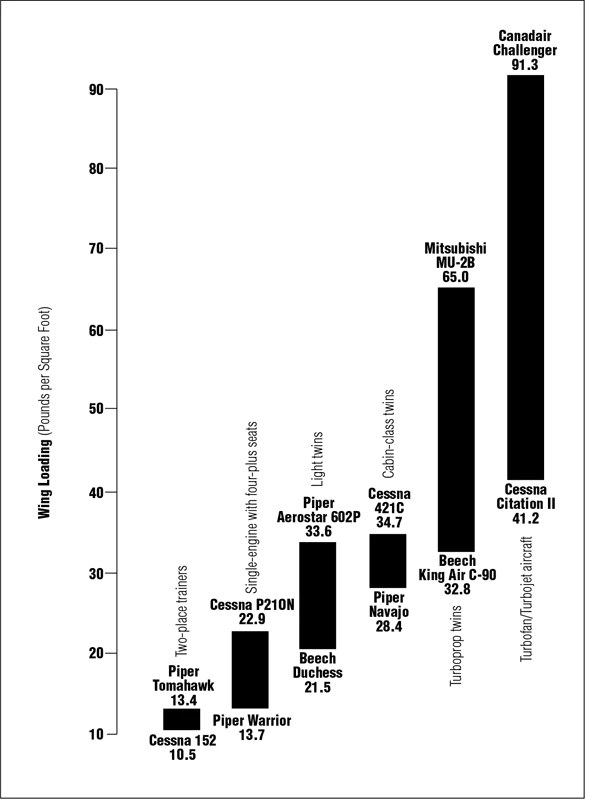
Figure 2 shows the range of wing loadings for several aircraft. For single-engine airplanes, for example, they vary from 10.5 pounds per square foot for a Cessna 152 to 22.9 for a Cessna P210N.
Figure 2. Ranges of wing loading for various groupings of airplanes
Some interesting wing-loading extremes also are worth noting. A Schweizer 1-26E sailplane has a wing loading of 4.4, which means that each square inch of wing produces only a half-ounce of lift. In contrast, each square foot of the Boeing 747’s 5,500-square-foot wing must lift 133 pounds, or almost a pound per square inch. The wing loading of Rockwell International’s B-1B bomber is an astonishing 239 pounds per square foot. Such a massive quantity of lift is possible—in part—because of the speed at which the B-1B moves through the air.
For a given wing at a given angle of attack, lift increases in proportion to the square of the airspeed. This partially explains why two airplanes with the same wing area can have different wing loadings. The Northrop F-5A Tiger and the Aeronca 7AC Champion are each supported by 170-square-foot wings. Their wing loadings, however, are 119.3 and 7.2, respectively.
For a given wing design, stall speed increases in proportion to the square root of the wing loading. In other words, quadrupling wing loading doubles stall speed, as well as takeoff and landing speeds.
Conversely, these speeds are reduced by decreasing wing loading (increasing wing area). But cutting the landing speed in half, for example, would necessitate quadrupling wing size. Because this would create excessive drag and erode cruise performance, the designer of a high-performance aircraft may have to sacrifice some slow-flight potential. Or he can reach into his bag of aerodynamic tricks and pull out an exotic set of flaps. But these can increase airframe weight and manufacturing cost.
A pilot, however, can decrease wing loading just as simply as he can decrease power loading: by reducing useful load (when maximum performance is necessary). For example, reducing the gross weight by 10 percent decreases takeoff speed by 5 percent, increases acceleration by at least 9 percent, and slashes takeoff distance by at least 21 percent. Also, climb rate increases in proportion to the weight reduction. A message is here for those who operate heavily loaded aircraft during marginal conditions.
Heavy wing loading generally is associated with high-performance aircraft. It also smoothes the ride in turbulence. This is because a heavily wing-loaded aircraft exposes less wing area (per unit of weight) to a given gust and is less susceptible to vertical acceleration (positive and negative Gs). This is one reason why increasing useful load makes a turbulent ride somewhat more tolerable. It also is why very heavily wing-loaded aircraft do not have to be constructed to withstand as many Gs as other airplanes. The Boeing 747, for instance, has limit load factors of +2.5 Gs and -1 G. General aviation airplanes certificated in the Normal category are stressed to +3.8 Gs and -1.52 Gs. In the Aerobatic category, they are stressed to +6 Gs and -3 Gs.
The lowest wing loadings are found on ultralight aircraft. This explains why ultralights are so sensitive to even the slightest gust.
A third factor used to predict aircraft performance is aspect ratio, which expresses the slenderness or stubbiness of a wing (or propeller blade or stabilizer). One way to determine aspect ratio is to divide wingspan by mean chord length. Sailplanes have extraordinarily long, slender, high-aspect-ratio wings. In other words, the ratio of span to chord is large.
In general, increasing aspect ratio reduces induced drag and improves climb, glide, and high-altitude performance. Lockheed’s U-2 “spyplane” is a classic example of how high-aspect-ratio wings improve aerodynamic efficiency. A designer, however, cannot arbitrarily increase aspect ratio without accepting a penalty. Lengthening a wing moves the center of lift farther outboard and necessitates beefing up the wing-root structure. Thi...