Univariate and Multivariate Statistical Approaches to the Analysis and Interpretation of NMR-based Metabolomics Datasets of Increasing Complexity
Notable historically-developed composites of advanced forms of statistical analysis and analytical/bioanalytical chemistry have been vital to the interpretation and understanding of the significance of results acquired in research (both natural sciences and clinical) and industry, with applications in numerous fields, including biomedical sciences, healthcare and environmental sciences. Herein, multicomponent nuclear magnetic resonance (NMR) analysis is used as a model to delineate how advanced statistical tools, both univariate and multivariate, can be implemented to effectively perform complex spectral dataset analyses in metabolomic applications, and to provide valuable, validated conclusions therein. Computational techniques are now embedded into spectral interpretation from an analytical chemist's perspective. However, there are challenges to applying such advanced statistical probes, which will be explored throughout this chapter.
1.1 Introduction
Although some statistical approaches were developed much earlier, such as the pioneering Bayesian statistics conducted in the 18th century,1 the interdisciplinary usage between science and statistics has still not been fully established. At present, there is a strong affinity between statistics and science, which dates back to the late 19th century and early 20th century. Works by Karl Pearson and Francis Galton, explored regression towards the mean, principal component analysis (PCA), and Chi-squared contingency table testing and correlation.2 Later, Spearman also developed his theory on factor analysis, namely Spearman's rank correlation coefficient, and applied it to the social sciences research area.3 William Gosset was responsible for the discovery of the t-test, which is embedded in most statistical testing applied in scientific fields to date, and which unfortunately remains the most widely abused, misapplied univariate form of statistical analysis test.4 Ronald Fisher tied the aforementioned ideas together, observing Gaussian distribution accounting for both chi-squared and the t-test to formulate the infrequently used F-distribution test. Fisher later developed analysis-of-variance (ANOVA), and defined p-values for determining the level of statistical significance.5 Fisher furthered these works by applying his knowledge to genetics, in particular the observation of alleles, specifically the frequency and estimation of genetic linkages by maximum likelihood methods within a population.6 Basic statistical hypotheses, such as H0 and H1, which still stand to date, were then established7 and are still fundamental to all experimental designs.
These statistical tools are now applied to just about every field possible; however, in science every research area has an element of statistical interpretation, from genomics in diseases diagnostics, forensic science and hereditary studies, the microbiome, and the discovery of biomarkers using biological immunoassays and ‘state-of-the-art’ bioanalytical techniques. In this chapter, modern advanced statistical methodologies will be explored through a major, now commonly employed multicomponent analytical/bioanalytical chemistry technique, namely nuclear magnetic resonance (NMR) spectroscopy. Statistical approaches and challenges which are associated with the collection of large or very large NMR datasets run in parallel with those of other multicomponent analytical techniques, such as liquid-chromatography–mass spectrometry (LC/MS), and hence the NMR examples provided serve as appropriate test models. Despite some problems occasionally being experienced with low sensitivity (especially at biofluid concentrations <10 μmol L−1) and untargeted analyses, which may result in xenobiotic resonances overlapping with those of endogenous metabolites, NMR provides many laboratory advantages over LC/MS in view of its high reproducibility, non-destructive methodology with minimal sample preparation, and the simultaneous detection and determination of 100 or more metabolites at operating frequencies greater than or equal to 600 MHz.8 NMR is a suitable analytical technique across many different fields and sample types, including food chemistry, geological studies, drug discovery, forensics and an increasingly expanding number of metabolomics areas, for example lipidomics and fluxomics. Both solid and liquid samples can be analysed, which is obviously advantageous. Moreover, major recent advances in the computational capability have enhanced the applications of metabolomics-linked statistical approaches, and current software modules and their applications will also be discussed here.
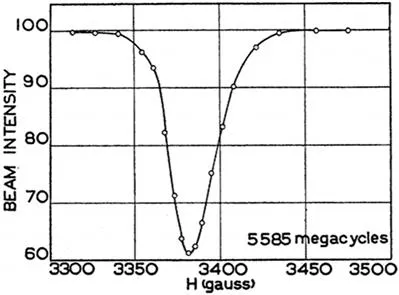
Indeed, NMR as a technique advanced much later than the statistical methods, therefore combining statistical tools with the data acquired occurred subsequently. Nuclear spin was first described by Pauli in 1926,9 and these ideas were then further developed by Rabi in 1939 who created the first radio frequencies for this purpose involving a beam of lithium chloride (Figure 1.1).10 Overhauser in 1953 observed dynamic nuclear magnetisation.11 Redfield then explored the theory of NMR relaxation processes,12 and NMR was then developed from these principles by Bloch and Purcell from 1945–1970, both of whom then won several Nobel Prizes.13,14 Continuous Wave (CW) methods were used to observe the nuclei spin, experiments which use a permanent magnet/electromagnet and a radio frequency oscillator to produce two fields, B0 and B1 respectively. To produce a resonance, CW methodologies were used to vary the B1 field or the B0 field to achieve resonance. In essence, the magnetic field is continuously varied and the peak signal (resonance) is recorded on an oscilloscope or an x–y recorder. However, these methodologies have substantially advanced, and at present radiofrequency pulse sequences are applied to nuclei within a magnetic field, B1.
Figure 1.1 7Li nucleus NMR signal originally observed by Rabi et al.10 Reproduced from ref. 10, https://doi.org/10.1103/PhysRev.55.526, with permission from American Physical Society, Copyright 1939.
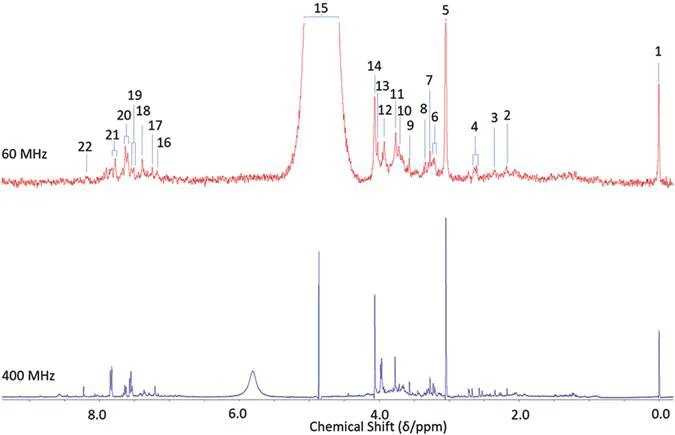
A range of NMR facilities are currently available, with the highest operating frequency reaching 1200 MHz, which requires a Gauss safety line and regular cryogen fills, in addition to more accessible permanent non-cryogen-requiring benchtop magnets operating at a frequency of up to 80 MHz. Progress in low-field NMR spectroscopy and their analytical applications, albeit very uncommon in metabolomic applications, has been recently reviewed.15 A whole plethora of spectrometers exist between these two extreme frequencies, and these all have the capacity and capability to acquire a wide range of molecular analyte data, which can subsequently be employed for statistical evaluations and comparisons. Biological fluids have been examined using both low-16 and high-frequency17 NMR technologies for monitoring of a range of endogenous metabolites and xenobiotics, although the use of high-frequency spectrometers is often the preferred approach because of the much-enhanced level of resolution and deconvolution of NMR signals. An example of the differences in resolution observed between low- (60 MHz) and high-field (400 MHz) NMR analysis is shown in Figure 1.2.
Figure 1.2 400 and 60 MHz NMR of the same urine sample from a control participant. Assignments include; [1] trimethylsilylpropanoic acid–CH3; [2] acetone–CH3; [3] pyruvate–CH3; [4] citrate–CH2A/B; [5] creatinine/creatine–CH3; [6] cis-aconitate–CH2; [7] taurine–CH2; [8] trimethyl-N-oxide–CH3; [9] glycine–CH3; [10] taurine–CH2; [11] unassigned-CH2; [12] creatine–CH2; [13] glycolate–CH2; [14] creatinine–CH2; [15] H2O–OH; [16] histidine–CH; [17] indoxyl sulphate–CH; [18] indoxyl sulphate–CH; [19] hippurate–CH; [20] hippurate–CH; [21] hippurate–CH; and [22] formate–CH.
The majority of biological fluids are predominantly composed of water, such as urine and saliva, and therefore appropriate pulse sequences have been developed to suppress these resonances in order to focus on those of interest. Pulse sequences such as water excitation technique (WET), nuclear Overhauser effect spectroscopy (NOESY),18 PRESAT and WATERGATE19 are highly suitable for the analysis of spectra containing such broad signals arising from the 1H nuclei in H2O. The water signal can be irradiated at...