Citizens around the world use crowdsourced platforms to hold governments accountable, to fill gaps in infrastructural and municipal services, and to call attention to issues that impact everyday lives, such as sexual violence and environmental injustice.
Crowdsourcing, Constructing and Collaborating brings together individuals and groups engaged in building and sustaining platforms for online collaboration and participation, to explore and reflect on the methods, challenges and potentials of the technology of crowdsourcing, and mapping of social impact. It brings together people directly involved in a range of projects from around the world-I Paid A Bribe, Environmental Justice Atlas, HarassMap, Intolerance Tracker, Visualizing Palestine, and Humanitarian Tracker-to critically reflect on the tactics, methods, challenges and opportunities of crowdsourcing and crowd-mapping as tools for social, environmental and political change.
In an accessible and visually engaging style, it shows how participatory digital media become crucial components of journalistic, scholarly and activist practices, addressing a range of topical challenges, including economic corruption, sexual harassment, political violence and environmental conflict, in diverse geographic contexts.
eBook - ePub
Crowdsourcing, Constructing and Collaborating
Methods and Social Impacts of Mapping the World Today
- 202 pages
- English
- ePUB (mobile friendly)
- Available on iOS & Android
eBook - ePub
Crowdsourcing, Constructing and Collaborating
Methods and Social Impacts of Mapping the World Today
About this book
Trusted by 375,005 students
Access to over 1.5 million titles for a fair monthly price.
Study more efficiently using our study tools.
Information
PART I
MAPPING CRISES
1
TRANSFORMING THE MAP?
Examining the Political and Academic Dimensions of the Environmental Justice Atlas
Introduction
Environmental justice activists, academics and activist–academics grapple daily with how to conduct politically sound theoretical work and theoretically sound political work on a topic that is both a field of study and a social movement (Temper and Del Bene 2016). The term ‘environmental justice’ was born in Black and Latino communities in the United States in the 1980s, as they resisted the disproportionate pollution they faced compared to white communities due to the placement of waste disposal facilities and industries. Later, it took the form of an analytical frame useful in understanding how different factors, including race, class, gender and age, shape unequal distribution of socio-environmental costs. More recently, environmental justice, both within academia and social movements, has been ‘globalising’, increasingly gaining in popularity and being employed as a common frame of understanding across diverse contexts, as well as a way to make visible the global dimensions of local environmental conflicts (Temper et al. 2015).
This chapter examines how political and academic goals and aspirations converge and sometimes conflict in the creation of a global-mapping project dedicated to charting this global movement for environmental justice through a database of place-based movements of environmental defence—The Environmental Justice Atlas or EJAtlas. Maps have often been used as a tool by environmental justice scholar–activists in their political and academic work (for example, the Atlas of Radical Geography1), though they tend to focus on individual or localised cases of environmental injustice, often in urban contexts. Like other environmental justice maps, EJAtlas was designed as an advocacy and policy tool, but with the global scope of its mapping and database, it has also become a platform for international networking and scholar–activist analysis.
Academics who are also activists, or who engage closely with social movements, have frequently discussed the often messy relationship between research and politics. From Freire’s (2000) work on emancipatory praxis to rich bodies of literature by critical race theorists, feminists, queer theorists, indigenous scholars and others, scholar–activists often question how to balance the academic and political motivations and dimensions of their work (Borras 2016, Temper et al. forthcoming). Many scholar–activists might feel they have ‘dual loyalties’ (Hale 2006) to both their academies and a political cause or social movement. Environmental justice work, as both a movement and a body of theory (Martinez-Alier et al. 2014), must be particularly aware of these tensions, as it simultaneously takes place and develops on the streets, in the mountains, in the classroom, by our rivers. Regarding EJAtlas, its main concern is how it can be used as a tool for and by social movements, against state and corporate interests, while maintaining high academic quality.
Based on survey data from visitors to the EJAtlas website, as well as feedback received via other means, this chapter reflects on the Atlas as an example of co-produced knowledge and ‘public political ecology’ (Osborne 2017). It looks at who is using the Atlas and why, and at tensions and complementarities between academics and politics that arise as we attempt to map environmental conflicts for transformative goals. We, the authors, have spent years directly working with EJAtlas, and are currently one of the co-directors and founders (Leah Temper), the coordinator (Daniela Del Bene) and a doctoral candidate both studying the Atlas and assisting with its continued development (Lena Weber).
To do so, we first discuss political and academic dimensions of environmental justice work, explain the birth, growth and objectives of EJAtlas, and describe the data gathering and documentation process used by EJAtlas to map out environmental conflicts and resistance. Then, we lay out our methodology for examining how diverse actors across the globe contribute to and use the Atlas. In the resulting analysis, we examine illuminating examples of who uses the Atlas and how they use it; we also examine questions around the visuals of mapping, including accessibility and politics of representation. Finally, we discuss academic and political challenges and opportunities presented by EJAtlas, and the tensions between the two, before briefly concluding with a note on the transformative potential of the data contained in the Atlas.
But Wait, What’s the Atlas?
A group of researchers at the Autonomous University of Barcelona came together in 2010 as part of a new large-scale initiative to investigate conflicts surrounding waste disposal and resource extraction in collaboration with social and environmental movements around the world. In order to systematise the information gathered about these environmental justice conflicts, the group, as part of the international EJOLT project,2 developed an online mapping tool called the Global Atlas of Environmental Justice, or EJAtlas (Temper et al. 2015). The Atlas maps cases of local resistance to economic activities that pivot environmental impact as a key grievance via input from diverse academic and non-academic contributors from around the world (ibid.).
Grounded in theory around how power inequalities spark environmental struggles (Porto and Pacheco 2009 in Temper et al. 2015), a long history of activist-led environmental justice theory building,3 and the need for more engaged, collaborative activist-academic knowledge production and analysis of environmental conflicts on a global scale, EJAtlas aimed to open up opportunities for political ecology4 to move beyond case studies to a much broader, systemic analysis. The Atlas aimed to respond to critiques that environmental justice literature within academia tends to be theoretically weak and disperse (Holifield, Porter and Walker 2009 in Temper et al. 2015).
Launched once it reached a thousand cases, EJAtlas is constantly growing, with 2,600 cases mapped as of November 2018. It receives almost 2,000 unique visits daily, and has hundreds of contributors, with information on conflicts dating back as early as first the contact with colonisers. Since its launch, the Atlas has received almost three million page views by over one million users. The platform also includes featured maps, which are maps that draw attention to a particular topic or region, and that makes sense of the ‘dots’ on the map. Conflicts are, in fact, not stand-alone processes, but are closely tied with a whole chain of production, transportation and consumption of goods and services.
The two projects currently coordinating EJAtlas are the Environmental Justice (ENVJustice) project and Academic–Activist Co-Produced Knowledge for Environmental Justice (ACKnowl-EJ) network based at the Institute of Environmental Science and Technology in the Autonomous University of Barcelona. These projects actively add to the Atlas and seek out contributions from specific regions of the world in an effort to grow the representability of the database. In this sense, the Atlas is not an organically crowdsourced project—though, of course, organic contributions do take place—but instead, it is an invited collaborative mapping process with exact methodologies changing from region to region. An article by EJAtlas founders (Temper et al. 2015) describes in more detail the data collection methodology, but it is important to note that contributors must demonstrate a solid knowledge of the case and context. In five years, EJAtlas has engaged around 500 unique contributors from more than 100 countries.
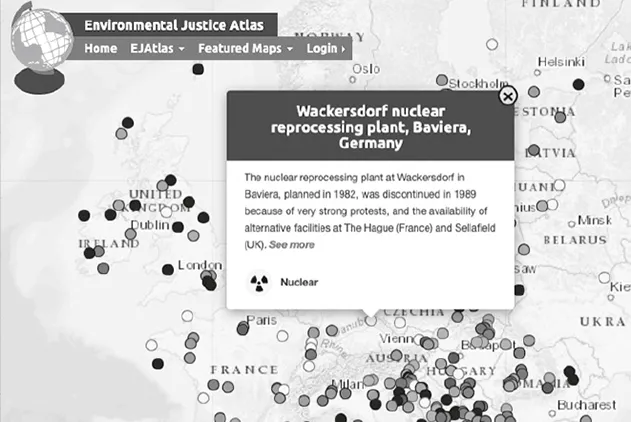
Figure 1.1: Pop-up description of individual conflict point.
Source: EJAtlas website.
EJAtlas uses a ‘North’-oriented world map projection with conflicts depicted as small points, coloured differently depending on the overarching conflict category they correspond to. When users click on a point, a small window opens with the conflict title and the first few lines of the conflict description (see Figure 1.1). By clicking ‘see more’, the map zooms in and isolates the selected conflict, with a side panel containing images and all the information input about the case, which can be scrolled through (see Figure 1.2).

Figure 1.2: Top: Selected conflict, Bottom: Side panel with full description of conflict point.
Source: EJAtlas website.
Featured maps go beyond conflict points to also include vector data, which can visually be turned on or off by the user, showing detailed information when clicked upon. These maps, often stemming from petitions from Environmental Justice Organisations (EJOs) or mixed academic–activist groups, also include a basic analysis of the political economy and political ecology that links together a group of conflicts and are produced with specific goals in mind (to use as a campaigning tool, for example, by an EJO). Recent examples include the Global Gas Lock-in, a map developed by activists working with London-based Gastivists and Barcelona-based Observatori del Deute en la Globalizació (ODG) to make visible resistance and conflict related to Europe’s plans to grow a massive web of gas infrastructure, even while claiming to embrace policies centred on sustainability and renewables. Another example is Mujeres Tejiendo Territorio, a map developed with the Latin American Network of Women Defenders of Social and Environmental Rights and the Colombian NGO CENSAT Agua Viva—Friends of the Earth Colombia to make visible Latin American women’s resistance to mining and their work in defence of life, dignity and territory. Figure 1.3 shows the clickable vector layers on a featured map called Fracking Frenzy, produced in collaboration with Friends of the Earth.
To contribute to the Atlas, visitors must create a user account and log in. Once logged in, they can generate a new conflict form to fill out. Once filled out, contributors submit the case for moderation. A member of the moderating team reviews the case and depending on the content either approves it and publishes it on the platform or writes to the contributor with suggestions for edits. The moderating team ensures that each case generally fits EJAtlas’ main criteria, namely that it centres on an economic activity or legislation with negative impacts on environment and society (actual or potential), that environmental justice organisation(s) and/or local individuals claim that this harm has taken place or will likely take place and, therefore, the need to mobilise and that the conflict is documented in one or more media stories5 (Temper et al. 2015).
Beyond mere documentation, the Atlas aims to facilitate transformative knowledge production, advocacy and activism while simultaneously contributing to ongoing theorising and networking around environmental justice issues. By making rural environmental conflicts visible, for example, it expands on the historical understanding of environmental justice struggles as primarily urban (Temper et al. 2015). Indeed, contributors to the Atlas have brought attention to more than 1,800 rural and semi-urban environmental conflicts, accounting for eighty-four per cent of all cases in the Atlas. Thus, the Atlas broadens the umbrella of environmental justice by demonstrating that issues of ecological distribution—often highlighted historically by environmental justice movements in urban United States, involving toxins and environmental racism (Pulido et al. 1996; Pulido 2000; Sicotte 2016)—are relevant in a wide diversity of socio-environmental struggles where communities claim for access to resources, health rights, land rights and more. At the same time, it addresses critiques of the overly rural and localised focus of political ecology by including hundreds of urban and semi-urban cases and globalising our understanding of environmental conflicts.
Moreover, while some goals of the Atlas are more explicitly political and others more clearly academic, there is quite a bit of overlap (Temper et al. 2015). More political goals include use of the Atlas to aid in denouncing environmental injustices, exchange of action strategies and strengthening international articulation between place-based movements, provision of reports on concrete cases and legal disputes to be used as a resource and to pressure policy-makers and politicians to support policies that are environmental justice friendly. More academic-oriented goals include theorisation, ‘a statistical understanding of environmental justice struggles’, and to aid ‘new processes of knowledge creation’ from an environmental justice perspective. Blurring the line further between the political and academic, the Atlas aims to facilitate productive lesson-learning via analysing case data, including patterns of mobilisation, success rates of resistance movements in stopping extraction projects, the impact of regulations and more (ibid.).
Finally, by mapping cases of environmental conflict on a global digital platform, EJAtlas aims to go beyond national or regional mapping, providing a tool for analysing multi-scale interactions inherent in global commodity chains, investing trends of transnational corporations, similarities across regions by type of conflicts, or groups mobilising, forms of protest and more (Del Bene et al. 2018; Avila 2018). Through this act of documentation and visibilisation, EJAtlas aims to support the transformative work of environmental justice activists and academics alike.
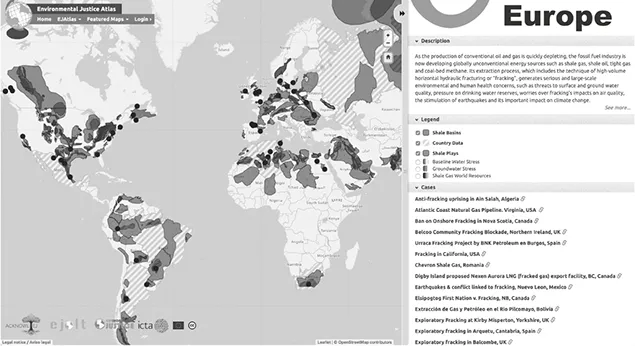

Figure 1.3: Fracky Frenzy featured map on EJAtlas with different vector layers turned on and off via the legend.
Source: EJAtlas website.
For this chapter, we zoom in on two key issues, as each provides important insight into the academic and political challenges and opportunities faced by such a large-scale collaborative environmental justice mapping project. These are: (a) How the Atlas is being used and contributed to, by whom, and for what? and (b) Accessibility and the politics of representation surround...
Table of contents
- Cover
- Half Title
- Title Page
- Copyright
- Dedication
- Contents
- Acknowledgements
- Introduction
- PART I: MAPPING CRISES
- PART II: CONTESTED TERRITORIES
- PART III: FEMINIST INTERVENTIONS
- PART IV: CIVIC ENGAGEMENTS
- Afterword: Methods and Social Impacts of Mapping the World Today
- Index
- About the Editors and Contributors
Frequently asked questions
Yes, you can cancel anytime from the Subscription tab in your account settings on the Perlego website. Your subscription will stay active until the end of your current billing period. Learn how to cancel your subscription
No, books cannot be downloaded as external files, such as PDFs, for use outside of Perlego. However, you can download books within the Perlego app for offline reading on mobile or tablet. Learn how to download books offline
Perlego offers two plans: Essential and Complete
- Essential is ideal for learners and professionals who enjoy exploring a wide range of subjects. Access the Essential Library with 800,000+ trusted titles and best-sellers across business, personal growth, and the humanities. Includes unlimited reading time and Standard Read Aloud voice.
- Complete: Perfect for advanced learners and researchers needing full, unrestricted access. Unlock 1.5M+ books across hundreds of subjects, including academic and specialized titles. The Complete Plan also includes advanced features like Premium Read Aloud and Research Assistant.
We are an online textbook subscription service, where you can get access to an entire online library for less than the price of a single book per month. With over 1.5 million books across 990+ topics, we’ve got you covered! Learn about our mission
Look out for the read-aloud symbol on your next book to see if you can listen to it. The read-aloud tool reads text aloud for you, highlighting the text as it is being read. You can pause it, speed it up and slow it down. Learn more about Read Aloud
Yes! You can use the Perlego app on both iOS and Android devices to read anytime, anywhere — even offline. Perfect for commutes or when you’re on the go.
Please note we cannot support devices running on iOS 13 and Android 7 or earlier. Learn more about using the app
Please note we cannot support devices running on iOS 13 and Android 7 or earlier. Learn more about using the app
Yes, you can access Crowdsourcing, Constructing and Collaborating by Siddharth Peter deSouza, Nida Rehman, Saba Sharma, Siddharth Peter deSouza,Nida Rehman,Saba Sharma,Siddharth Peter de Souza in PDF and/or ePUB format, as well as other popular books in Politics & International Relations & Civics & Citizenship. We have over 1.5 million books available in our catalogue for you to explore.