![]()
Part I
The Conceptual Provisions of the Circular Economy and Its Essential Differences from the Linear Model of Economic Development
![]()
Chapter 1
Criticism of the Linear Model of Economic Development and its Opposition to the Model of the Circular Economy
Larisa A. Ilyina, Yuliya A. Panteleeva, Vladimir S. Tikhonov and Olga A. Babordina
JEL Codes: D91; E01; F42; F43; F64; Q01; Q15; Q56; Q57; O13; O41; O43; O44; O47
1. Introduction
In the modern global economy, the interests of economic growth contradict the interests of environment protection more and more. Ecological costs are at the brink of advantages from economic growth or even exceed them, and the signs of climate change could be seen everywhere. The importance of this contradiction was reflected in the adopted sustainable development goals, in which the main attention is paid to environment protection.
The ideas of sustainable development are embodied in the model of the circular economy, which allows decreasing the ecological costs of production and consumption, thus overcoming the contradiction of economic growth and environment protection. Despite the long and thorough scientific elaboration and a large theoretical and methodological basis, the model of the circular economy is not widely used. An argument in favor of refusal from it – for preserving the traditional, linear model of economic development – is the uncertainty of the investment component of circular projects.
Firstly, the clear influence of the state of environment on population’s level of happiness has not been scientifically proved. As social advantages cannot be forecasted precisely, circular project is not too attractive for the state, which prefers the projects with more profits for society. The long-term character of investments in circular projects and lack of transparency of the perspectives of their return – caused by the fact that the circular economy generates not economic but public benefits – hinders the inflow of private capital. Without financial support, circular projects – like any others – cannot be realized.
Secondly, under the pressure of philosophy of consumer society, there formed an official (proclaimed and acknowledged by the state) belief that economic growth defines population’s happiness. Business’s aggressive marketing confirms this idea. Tough there are no scientific proofs of that, the state does not require them, showing loyalty to business, which lobbies its own interests. As the circular economy is associated with limited economic growth, it is treated negatively.
Thirdly, there is a popular idea – without any scientific substantiation – that increased resource efficiency limits the possibilities of production and consumption and reduces economic growth, raising the quality of life, shared by all economic subjects – state, business, and society. A logical result of this idea, which is treated as risk, is measures of risk management, aimed at restraining the circular economy and preventing its development.
The purpose of this chapter is to scientifically verify the existing argument in favor of the linear model of economic development and to overcome the uncertainty regarding the model of the circular economy.
2. Materials and Method
The general issues of economic growth and development, based on the linear model, are studied in the works, such as Ermolina and Ilyina (2017), Ilyina and Brazhnikov (2016), Ilyina, Brazhnikov, and Khorina (2017), Ilyina, Ermolina, and Sunteev (2018), Popkova (2018), Popkova and Alferova (2019), Popkova and Sukhodolov (2017), Ragulina (2019), Ragulina, Alekseev, Strizhkina, and Tumanov (2019a), Ragulina, Semenova, Avkopashvili, Dmitrieva, and Cherepukhin (2019b), Sergi (2003, 2019), Sergi, Popkova, Borzenko, and Przhedetskaya (2019), and Sergi, Popkova, Sozinova, and Fetisova (2019). Certain conceptual settings and methodological recommendations for organizing the model of the circular economy are given in the works, such as Batista, Gong, Pereira, Jia, and Bittar (2019), Blomsma et al. (2019), Franco (2019), Frolov, Popkova, Strekalova, and Marushchak (2017), Inshakov, Bogachkova, and Popkova (2019), Petrenko, Pritvorova, and Dzhazykbaeva (2018), Popkova, Poluyufta, Beshanova, Popova, and Kolesnikova (2017), Sergi, Popkova, Borzenko, and Przhedetskaya (2019a), Shakhovskaya, Petrenko, Dzhindzholia, and Timonina (2018), Termeer and Metze (2019), and Zhang et al. (2019).
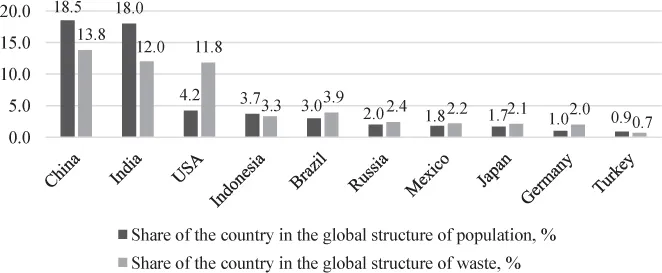
The overview performed on the existing literature sources showed that they do not provide a sufficient scientific basis for clear opposition of the linear and the circular economy or a comprehensive idea of the model of the circular economy. The authors use the method of comparative and correlation analysis of statistical data for filling this gap in the system of scientific knowledge. The research objects are top 10 countries from G20, which had the highest number of population and the largest volume of economy’s waste in 2019 (Fig. 1).
Fig. 1. Top 10 Countries of the World in 2019 by Population and Waste. Source: Compiled by the authors based on Verisk Maplecroft (2019).
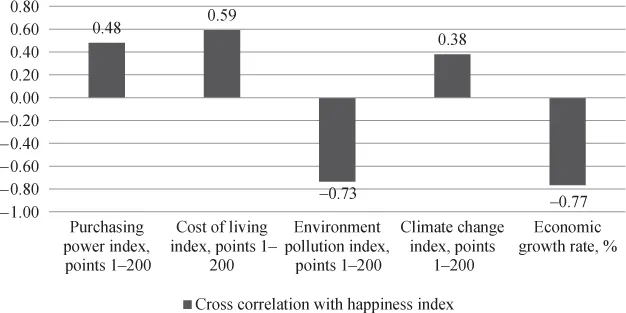
Fig. 2. Cross Correlation of the Indicators of Linear and Circular Development and Economic Growth with Happiness Index in Top 10 Countries by Population and Waste (2019). Source: Calculated and built by the authors.
As shown in Fig. 1, the number of population does not always define the volume of economy’s waste. This contradiction is most vivid in the United States; it accounts for 4.2% of the world population, with 11.8% in the global volume of waste. The selection of statistical data that are used during the research is shown in Table 1.
3. Results
Cross correlation of the indicators of linear and circular development and economic growth with the happiness index in top 10 countries of the world in 2019 by population and waste is shown in Fig. 2.
As shown in Fig. 2, the economic indicators show moderate connection with the happiness index. Cross correlation of the index of population’s purchasing power and the happiness index equals 0.48, and of the cost of living index equals 0.59. The indicator of circular development – environment pollution index – showed much higher connection with the happiness index: −0.73. It should be noted that another indicator of circular development – index of climate change – showed moderate connection with the happiness index – 0.38.
Table 1. Statistics of the Circular Economy and Economic Growth in Top 10 Countries of the World in 2019 by Population and Waste.
Source: Compiled by the authors based on Helliwell, Layard, and Sachs (2019), Numbeo (2019), and World Bank (2019).
This shows that ecological factors have stronger influence on the levels of happiness of population than economic factors. However, the influence of ecological factors is too differentiated, as they are felt by the society to a different extern. For example, production waste is seen in the growing number of dumps, and climate change is less vivid. Rate of economic growth showed negative cross correlation with the happiness index (−0.77). This means that economic growth is connected to population’s happiness level, but in the reverse way – the higher the rate of economic growth, the lower the level of happiness.
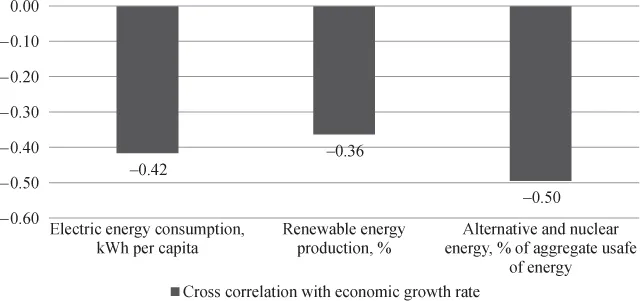
Cross correlation of the indicators of energy efficiency with the rate of economic growth in top 10 countries by population and waste (2019) is shown in Fig. 3.
As shown in Fig. 3, the indicators of energy efficiency have negative cross correlation with the rate of economic growth, which constitutes −0.42 for electric energy consumption per capita; −0.36 for production of renewable energy; and −0.50 for alternative and nuclear energy. This means that certain manifestations of the circular economy – in particular, optimization of production and consumption of energy – restrain economic growth, at least within the current technological mode and the current organizational and managerial approach.
The basic conceptual model of the circular economy is shown in Fig. 4.
Fig. 3. Cross Correlation of the Indicators of Energy Efficiency with the Rate of Economic Growth in Top 10 Countries by Population and Waste (2019). Source: Calculated and built by the authors.
As shown in Fig. 4, t...