The Key Indicators for Asia and the Pacific 2020, the 51st edition of this series, includes the latest available economic, financial, social, and environmental indicators for the 49 regional members of the Asian Development Bank. It presents the latest key statistics on development issues concerning the economies of Asia and the Pacific to a wide audience, including policy makers, development practitioners, government officials, researchers, students, and the general public. Part I of this issue presents the current status of economies of Asia and the Pacific with respect to the Sustainable Development Goals based on selected indicators from the global indicator framework. Part II comprises statistical indicators that capture economic, financial, social, and environmental developments. Part III presents key statistics and stylized facts on the phenomenon of global value chains.
- 330 pages
- English
- ePUB (mobile friendly)
- Available on iOS & Android
eBook - ePub
About this book
Trusted by 375,005 students
Access to over 1.5 million titles for a fair monthly price.
Study more efficiently using our study tools.
Information
PART I
Sustainable Development Goals Trends and Tables
Sustainable Development Goals—Data Stories
The United Nations (UN) Sustainable Development Goals (SDGs) were adopted in September 2015 to set targets for global development that would be achieved within 15 years. Economies in Asia and the Pacific are working toward achieving the 17 goals and 169 targets that comprise the SDG framework. A total of unique 231 statistical indicators are used to track the progress of individual economies toward meeting the SDGs.1
Fewer than 10 years remain to achieve the SDGs. At the SDG Summit in September 2019, world leaders pledged to mobilize financing, enhance national implementation, and strengthen institutions to achieve the SDGs by 2030, leaving no one behind (UN 2020a). However, progress made toward achieving many SDGs is being threatened by the COVID-19 pandemic. In addition to the immediate health crisis, lockdowns and travel restrictions have disrupted domestic, regional, and global supply chains; shuttered businesses and left millions unemployed; closed schools and severely curtailed education and job training opportunities for people of all ages; and adversely impacted mental and physical health by restricting access to health care. On 31 July 2020, the Director-General of the World Health Organization described the pandemic as “a once-in-a-century health crisis, the effects of which will be felt for decades to come” (UN News 2020).
Data availability is an area of concern for tracking progress in achieving the SDGs and for the design, implementation, and monitoring of national development plans. A primary constraint to the availability of sufficient data is often a lack of resources devoted to the development of statistics at the economy level (PARIS21 2017). Approved by the UN Statistics Division in March 2017, the Cape Town Global Action Plan for Sustainable Development Data appeals to governments to provide the funding necessary to upgrade national statistical systems, use a combination of traditional and innovative data sources, and harness strategic partnerships with an array of stakeholders (UNSC 2017).
The updated SDG indicator framework comprises a two-tier classification system based on data availability and whether the methodology is well established. Tier I indicators are those with a clearly established methodology and where data are being regularly collected by many economies. Tier II indicators are those with an established methodology, but where data are not regularly collected by many economies. Of the 231 SDG indicators, 123 belong to Tier I, 106 belong to Tier II, and 2 have multiple tiers, i.e., different components of the indicator are classified into different tiers (UNSC 2020).
Part I of Key Indicators for Asia and the Pacific 2020 provides an SDG status update for ADB’s 49 member economies located across Asia and the Pacific, outlining their progress toward achievement of the Sustainable Development Agenda. In addition to the data tables, the discussions for select SDG indicators are accompanied by supporting data stories and charts. Most of the statistics presented in the tables and charts are presented for two data points from 2000 to 2019. Data gaps and other data-related issues are also considered to inform any related policy actions.
SDG 1. End poverty in all its forms everywhere

Much of developing Asia’s gains in reducing extreme poverty are at risk of reversal from a global recession in the wake of COVID-19
Those in extreme poverty struggle to meet basic needs and often lack access to healthcare, education, and water and sanitation. The Asia and Pacific region’s recent achievements in reducing extreme poverty are threatened by the COVID-19 pandemic and the ensuing global recession caused by measures to contain the virus. The World Bank estimates that between 71 million and 100 million people around the world may be pushed into extreme poverty in 2020 (World Bank 2020).
In developing Asia, the percentage of people living in extreme poverty—as measured by surviving on less than $1.90 per day at 2011 purchasing power parity—fell significantly from 33.5% in 2002 to 6.9% in 2015 (Figure 1.1.1). In absolute terms, this represented a decline from 1,109 million people in extreme poverty to 263 million during the review period. The bulk of this decline occurred in East Asia (from 406 million people in 2002 to 10 million people in 2015) and South Asia (from 505 million people in 2002 to 200 million people in 2015).
Figure 1.1.1: Proportion and Number of People Living in Extreme Poverty

M = million.
Note: The size of the bubbles refers to the number of people living in extreme poverty, and the numbers next to the bubbles indicate the proportion of population in extreme poverty and the number of extreme poor in millions.
Source: Asian Development Bank estimates using World Bank. PovcalNet Database: http://iresearch.worldbank.org/PovcalNet/home.aspx (accessed 27 March 2020).
Click here for figure data
As a percentage of the overall population, extreme poverty fell in every subregion in developing Asia and the Pacific from 2002 to 2015: Central and West Asia (from 29.3% in 2002 to 5.8% in 2015), East Asia (from 31.6% to 0.7%), the Pacific (from 46.1% to 24.8%), South Asia (from 39.7% to 13.2%), and Southeast Asia (from 24.8% to 5.4%).
In a majority of the economies reporting for 2019, less than 10% of employed people were living in extreme poverty
The proportion of the employed population living in extreme poverty (i.e., “the working poor”) in 2019 was less than 10.0% in 20 of the 26 economies with available data, as shown in Figure 1.1.2. Those economies with a share of the working poor to total population at 0.5% or less were Mongolia with 0.1%; Fiji with 0.2%; Armenia, the Kyrgyz Republic, and Sri Lanka with 0.3% each; and the People’s Republic of China (PRC) with 0.5%. The share of the employed population living in extreme poverty as a percentage of the total population exceeded 15.0% in five economies. The highest shares of the working poor as a percentage of total population in 2019 were observed in Afghanistan (40.1%), Papua New Guinea (21.8%), Timor-Leste (21.8%), Uzbekistan (19.7%), and Solomon Island (17.7%)
Figure 1.1.2: Proportion of Employed Population Living below the International Poverty Line
(%)
(%)
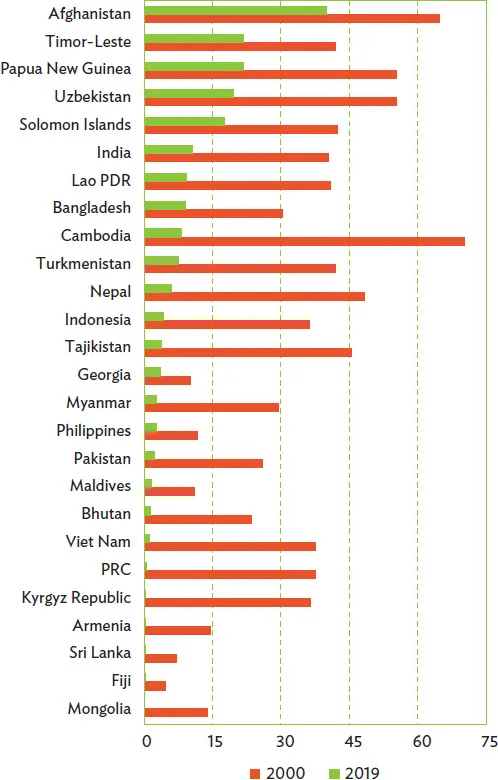
Lao PDR = Lao People’s Democratic Republic, PRC= People’s Republic of China
Note: Only economies with values greater than zero for both years are included.
Source: Table 1.1.1, Key Indicators for Asia and the Pacific 2020.
Click here for figure data
From 2000 to 2019, the share of the working poor as a percentage of the total population fell in all 26 reporting economies. The largest declines occurred in Cambodia (62.0 percentage points), Nepal (42.2 percentage points), and Tajikistan (41.9 percentage points).
SDG 2. End hunger, achieve food security and improved nutrition, and promote sustainable agriculture

Undernourishment declined in more than three-quarters of economies from 2001 to 2018
According to the Food and Agriculture Organization of the United Nations, more than 820 million people in the world went hungry in 2018, highlighting the difficulty in achieving the SDG target of eradicating hunger by 2030 (FAO 2019). Furthermore, economic downturns disproportionally undermine food security and nutrition where income inequality is prevalent, especially in low-income economies. This does not bode well for the many economies of the Asia and Pacific region suffering economic shocks caused by measures to combat the COVID-19 pandemic.
Of the region’s 37 economies with available data, 28 reported a decline in the prevalence of undernourishment from 2001 to 2018 (Figure 1.2.1). The largest reductions during the review period occurred in ...
Table of contents
- Front Cover
- Title Page
- Copyright Page
- Contents
- Foreword
- Acknowledgments
- Statistical Partners
- Guide for Users
- Highlights
- Part I: Sustainable Development Goals Trends and Tables
- Part II: Regional Trends and Tables
- Part III: Global Value Chains
- Definitions
- Back Cover
Frequently asked questions
Yes, you can cancel anytime from the Subscription tab in your account settings on the Perlego website. Your subscription will stay active until the end of your current billing period. Learn how to cancel your subscription
No, books cannot be downloaded as external files, such as PDFs, for use outside of Perlego. However, you can download books within the Perlego app for offline reading on mobile or tablet. Learn how to download books offline
Perlego offers two plans: Essential and Complete
- Essential is ideal for learners and professionals who enjoy exploring a wide range of subjects. Access the Essential Library with 800,000+ trusted titles and best-sellers across business, personal growth, and the humanities. Includes unlimited reading time and Standard Read Aloud voice.
- Complete: Perfect for advanced learners and researchers needing full, unrestricted access. Unlock 1.5M+ books across hundreds of subjects, including academic and specialized titles. The Complete Plan also includes advanced features like Premium Read Aloud and Research Assistant.
We are an online textbook subscription service, where you can get access to an entire online library for less than the price of a single book per month. With over 1.5 million books across 990+ topics, we’ve got you covered! Learn about our mission
Look out for the read-aloud symbol on your next book to see if you can listen to it. The read-aloud tool reads text aloud for you, highlighting the text as it is being read. You can pause it, speed it up and slow it down. Learn more about Read Aloud
Yes! You can use the Perlego app on both iOS and Android devices to read anytime, anywhere — even offline. Perfect for commutes or when you’re on the go.
Please note we cannot support devices running on iOS 13 and Android 7 or earlier. Learn more about using the app
Please note we cannot support devices running on iOS 13 and Android 7 or earlier. Learn more about using the app
Yes, you can access Key Indicators for Asia and the Pacific 2020 by in PDF and/or ePUB format, as well as other popular books in Economics & Finance. We have over 1.5 million books available in our catalogue for you to explore.