Gerard Roland's new text, Development Economics, is the first undergraduate text to recognize the role of institutions in understanding development and growth. Through a series of chapters devoted to specific sets of institutions, Roland examines the effects of institutions on growth, property rights, market development, and the delivery of public goods and services and focuses. With the most comprehensive and up to date treatment of institutions on development, Roland explores the important questions of why some countries develop faster than others and why some fail while others are successful.
- 648 pages
- English
- ePUB (mobile friendly)
- Available on iOS & Android
eBook - ePub
Development Economics
About this book
Trusted by 375,005 students
Access to over 1.5 million titles for a fair monthly price.
Study more efficiently using our study tools.
Key takeaways
AI-Generated Insights
Insight 1
Analyze the dynamics of the development gap, poverty, and inequality by applying core economic growth models and theories of demographic transition.
Insight 2
Evaluate the profound impact of various institutional structures, including political, legal, and market institutions, on economic development, growth, and the delivery of public goods and services.
Insight 3
Assess the effectiveness of different development strategies and trade policies, and analyze the economic determinants and consequences of challenges like corruption and conflict in developing economies.
Information
The Development Gap | 1 |
Students who are interested in studying development economics may have various motivations for doing so. They might have idealistic motivations and want to help eradicate poverty and disease in poor countries. They may intend to work for a non-governmental organization (NGO) or an international development aid agency to achieve these goals. Better knowledge of development economics can provide more useful solutions to help the poor in developing economies. Students might also have intellectual motivations and want to understand why poverty can be so persistent and how development economics can contribute to finding solutions to poverty. Why can our planet produce enough food to feed all its inhabitants, yet hundreds of millions of people still suffer from hunger? Which economic policies work best, at the regional, national, urban, and village levels, to help people escape poverty, achieve higher living standards, receive better health care and education, and live longer? How can development economics provide answers to those questions?
There is no better way to introduce the topic of economic development than with some striking pictures. Figures 1.1a, 1.1b, and 1.1c show three different world maps produced by Mark Newman, at the Department of Physics and the Center for the Study of Complex Systems at the University of Michigan. The first map displays the landmass of the world’s countries. The second map represents the size of countries as proportional to their population; for example, China and India appear much larger than on standard maps since they have populations, respectively, of 1.3 and 1.2 billion people. Japan and Indonesia also appear larger. Notice how Russia and Canada appear much smaller than on standard maps. On the African continent, South Africa, Nigeria, Egypt, and Ethiopia appear larger, while on the North American continent, Mexico also appears larger.
In the third map, the size of a country appears as proportional to its gross domestic product. Here, the United States, Europe, and Japan appear very large, and Germany appears nearly as large as China. Notice how Central and South America and Africa have become tiny.
These three maps clearly illustrate the challenges of economic development in the world. The overwhelming majority of the world’s population lives in developing countries, while most economic activity takes place in a few rich countries such as the United States, Japan, or the nations of Western Europe. Most people on the planet still have very low living standards and roughly one billion people live in conditions of great poverty, surviving on less than a dollar a day. The study of economics should not, therefore, view the issues of economic development as a marginal or exotic subject. It is the most important economic problem on our planet and development ] on the lives of people around the world.
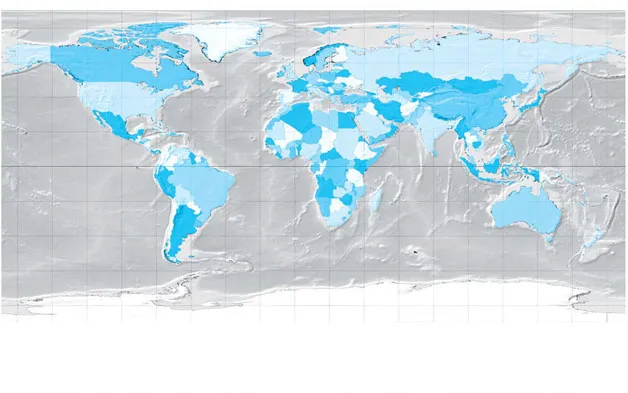
FIGURE 1.1a The Actual Land Mass of the World’s Countries
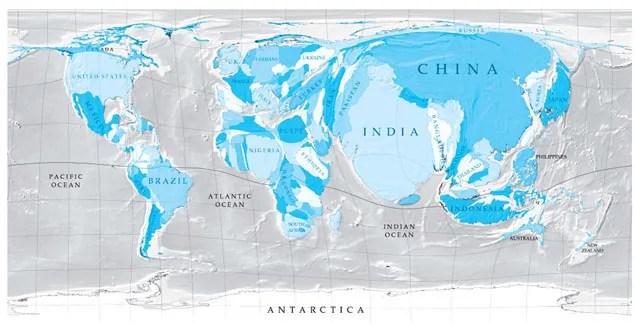
FIGURE 1.1b A World Map Representing a Country’s Size as Proportional to Its Population
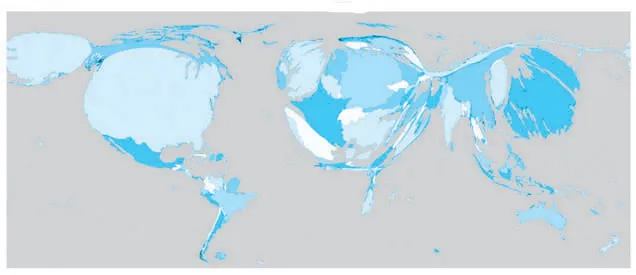
FIGURE 1.1c A World Map Representing a Country’s Size as Proportional to Its Gross Domestic Product
In the first map, country sizes are proportional to their landmass; in the second map, they are proportional to their populations; and in the third map, they are proportional to their gross domestic product.
Source: Printed with permission from Mark Newman, University of Michigan. http://www-personal.umich.edu/~mejn/cartograms/.
In this chapter, we examine some of the most important facts about economic development and consider some of the main questions studied in development economics. We first learn about the development gap, the differences in economic development between the advanced economies of the United States, Japan, and the Western European nations and the poorer economies of Africa, Asia, Latin America, and Eastern Europe. We review measures of the development gap in terms of income, life expectancy, health, education, and level of urbanization, which will provide a fresh and precise perspective on the scope of the development gap between the richest and poorest countries in the world.
This gap has been evolving over time, decreasing for some countries while increasing for others. For example, in recent decades some Asian countries such as China and India have successfully undertaken a vigorous process of development and have begun to close the gap with the richest countries. Obviously there is still a long way to go, but it is encouraging to see that there are some major success stories in developing nations, and they may help us better understand why the development gap has unfortunately increased in many other poor countries. Another important fact we must consider is that development is not irreversible: rich countries can be engaged in a process of economic decline. Argentina was among the richest countries in the world at the beginning of the 20th century, but over the next 50 years, it experienced a significant downturn in its economy. Development economists have primarily focused on the success or failure of development in poor countries; they have paid less attention to the phenomenon of the decline of countries who had already achieved success in economic development. It is critical to understand economic decline in order to prevent it.
Facts about the Development Gap
There are different ways to measure the gap in economic development between rich and poor countries. We will look at the income gap, the health gap, the education gap, and the differences in rates of urbanization across the world.
The Income Gap
The first and most obvious way to measure the development gap is to measure the income gap between developed economies and poor countries. A common measure of income is gross domestic product (GDP) per capita. This is a measure of the value of output produced per inhabitant of a country during a given year. Gross domestic product per capita is a good approximation of average annual per capita income. The only difference is that annual per capita income adjusts for income flowing into or out of the country, as well as for foreign aid and remittances. Of course, these can be significant for poor countries. Nevertheless, GDP is the single most widely used measure of a country’s economic size. In order to compare across countries, we need to express GDP per capita in U.S. dollars (or some other common currency). In development economics, it is important to use exchange rates based on purchasing power parity (PPP) when converting GDP per capita in the local currency to U.S. dollars. Purchasing power parity exchange rates are based on the prices of all goods and services, and are constructed such that the same basket of goods in one country has the same dollar value in all countries.
Let us look at GDP per capita across countries in 2010 using purchasing power parity. Luxemburg is the richest country in the world with a GDP per capita of $86,000. The world’s poorest country is the Democratic Republic of Congo (formerly called Zaire) with a GDP per capita of only $350. This is a very large difference, close to 1:250. Other rich countries include the United States, Norway, Singapore, Qatar, and the United Arab Emirates with a gross domestic product (GDP) per capita around $50,000. Most European countries have a GDP per capita between $20,000 and $40,000. In contrast, 12 countries, including Congo have a GDP per capita lower than $1,000. These include Burundi, Liberia, Eritrea, Niger, the Central African Republic, Sierra Leone, Malawi, Timor-Leste, Mozambique, Madagascar, and Togo. Apart from Timor-Leste in Southeast Asia, all of these countries are in sub-Saharan Africa. Figure 1.2 shows a map of GDP per capita based on purchasing power parity.
Comparing Per Capita Incomes across Countries Using Purchasing Power Parity (PPP) Exchange Rates
Using PPP to measure a country’s GDP (or any other statistical data) means that we must use an exchange rate based on purchasing power parity instead of the market exchange rate to obtain a dollar measure of GDP for that country. The purchasing power parity measure computes exchange rates between currencies of different countries so that the same basket of goods in any two different countries has the same dollar value. This is difficult to do but is important for making international income comparisons. One dollar will typically buy less in a rich country than in a poor country if we use existing exchange rates. For example, one U.S. dollar was exchanged internationally in 2012 at roughly 55 Indian rupees. However, 55 Indian rupees will typically buy more things in India than will one U.S. dollar in the United States. The purchasing power parity exchange rate will thus be lower than 55 rupees per dollar, probably closer to 40 rupees or even less. The world’s poorest people live on less than one dollar a day. Even though they live under conditions of extreme poverty, they can typically buy more with one dollar in their country than a resident of New York, Tokyo, or London can purchase with that same dollar.
The reason why market exchange rates do not equalize purchasing power parity is that exchange rates are based only on the prices of tradable goods and do not take into account nontradables, i.e., goods and services that are not traded internationally. Non-tradable goods are usually less expensive in poorer countries. Many of these non-tradable goods are services and their price is related to the cost of labor, which is lower in poorer countries. For example, the price of a haircut is usually lower in poorer countries. The technology for cutting hair is basically the same everywhere and the cost is essentially the wage of the hairdressers. A haircut is a non-tradable service because people do not typically travel across countries to get a cheaper haircut.
As we can see from Figure 1.2, most of the world’s poorest countries are in Africa. South Africa is the richest country on the continent with slightly over $...
Table of contents
- Cover
- Half Title
- Title Page
- Copyright Page
- Brief Contents
- Table of Contents
- Introduction
- Chapter 1 The Development Gap
- Chapter 2 Poverty and Inequality
- Chapter 3 Population Growth
- Chapter 4 Economic Growth
- Chapter 5 Structural Change and Development Strategies
- Chapter 6 International Trade and Exchange Rates
- Chapter 7 Institutions and Economic Development
- Chapter 8 Markets and Hierarchies
- Chapter 9 Political Institutions
- Chapter 10 Legal and Fiscal Institutions
- Chapter 11 Culture
- Chapter 12 Rural Land Rights and Contracts
- Chapter 13 Property Rights and Efficiency in Urban Areas
- Chapter 14 Market Development
- Chapter 15 The Role of Credit Markets in Development
- Chapter 16 Health Care Delivery in Developing Countries
- Chapter 17 Delivering Education in Developing Countries
- Chapter 18 Delivering Infrastructure in Developing Countries
- Chapter 19 Corruption
- Chapter 20 Conflict
- Appendix Econometric Appendix
- Glossary
- Index
Frequently asked questions
Yes, you can cancel anytime from the Subscription tab in your account settings on the Perlego website. Your subscription will stay active until the end of your current billing period. Learn how to cancel your subscription
No, books cannot be downloaded as external files, such as PDFs, for use outside of Perlego. However, you can download books within the Perlego app for offline reading on mobile or tablet. Learn how to download books offline
Perlego offers two plans: Essential and Complete
- Essential is ideal for learners and professionals who enjoy exploring a wide range of subjects. Access the Essential Library with 800,000+ trusted titles and best-sellers across business, personal growth, and the humanities. Includes unlimited reading time and Standard Read Aloud voice.
- Complete: Perfect for advanced learners and researchers needing full, unrestricted access. Unlock 1.5M+ books across hundreds of subjects, including academic and specialized titles. The Complete Plan also includes advanced features like Premium Read Aloud and Research Assistant.
We are an online textbook subscription service, where you can get access to an entire online library for less than the price of a single book per month. With over 1.5 million books across 990+ topics, we’ve got you covered! Learn about our mission
Look out for the read-aloud symbol on your next book to see if you can listen to it. The read-aloud tool reads text aloud for you, highlighting the text as it is being read. You can pause it, speed it up and slow it down. Learn more about Read Aloud
Yes! You can use the Perlego app on both iOS and Android devices to read anytime, anywhere — even offline. Perfect for commutes or when you’re on the go.
Please note we cannot support devices running on iOS 13 and Android 7 or earlier. Learn more about using the app
Please note we cannot support devices running on iOS 13 and Android 7 or earlier. Learn more about using the app
Yes, you can access Development Economics by Gérard Roland,Gerard Roland in PDF and/or ePUB format, as well as other popular books in Economics & Economic Theory. We have over 1.5 million books available in our catalogue for you to explore.