First Published in 2017. As an applied branch of mathematics, statistical analysis is straightforward and non- controversial. Yet, there are dangers in using statistics that derive from two sources: Statistical Tricks: These occur when researchers deliberately attempt to mislead their readers. Also Statistical Traps: A researcher falls into a statistical trap when he or she naively or carelessly misapplies statistical methods or employs unsound research methods to generate statistical data. While a trap is not intentional, it can produce highly misleading results. However, this book will teach you what types of important questions researchers should address in their reports, and you will learn to take their results with a large grain of salt if they are not addressed.
eBook - ePub
Statistical Tricks and Traps
An Illustrated Guide to the Misuses of Statistics
- 58 pages
- English
- ePUB (mobile friendly)
- Available on iOS & Android
eBook - ePub
Statistical Tricks and Traps
An Illustrated Guide to the Misuses of Statistics
About this book
Trusted by 375,005 students
Access to over 1.5 million titles for a fair monthly price.
Study more efficiently using our study tools.
Information
Part I Sampling
Trick or Trap 20
Predicting a Presidential Election?
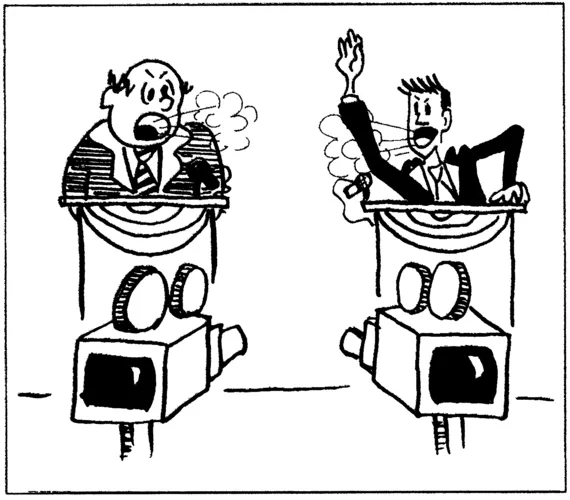
During presidential elections, the press often runs short reports on factors that might predict the outcome of an election—based on the outcomes of previous elections. Let's consider two examples from the presidential cycle in which Bill Clinton was being challenged by Bob Dole.
First, Time magazine reported that "The candidate who appeared on screen to the left of his major opponent in the first debate has typically won the election. The one exception: Ronald Reagan."1 This was reported shortly before the 1996 election. Up to that point, there had been only nine presidential elections with televised debates, so the winner had been on the left seven times and on the right twice. In 1996, Bob Dole was on the left during the first debate and lost, so the score became seven to three. Even at seven to three, the odds still favor the candidate on the left, but would you stake the family fortune by betting on the candidate on the left in the next election without even knowing who the candidates will be? If you answered no, you probably recognized a fundamental problem with these statistics: the sample is too small. With very small samples, it's easy for coincidental relationships to emerge.
In the second example, Newsweek pointed out that every time the New York Yankees won the World Series during an election year, the Republican candidate has won the White House.2 However, up to the point that the election was held, the Yanks had played in the World Series only five presidential election years. Both they and the Republicans won in 1952 and 1956, and both lost in 1960, 1964, and 1976. Once again, the sample is obviously too small to draw reliable conclusions. Also notice that there is no reason in theory to expect the outcome of the World Series to be related to the outcome of a presidential election. This is important because a finding based on a very small sample that has no basis in logic or theory is especially suspicious.
The reporters undoubtedly knew that these were unreliable predictors of the presidential elections and presented the reports as interesting asides. Yet, many people find it all too easy to fall into the trap of generalizing from a very small sample to reach a broader conclusion. For example, suppose you visited a distant city on vacation and got robbed on the street. Would you be tempted to generalize from this sample of just one visit that the city is especially dangerous? Sound statistical reasoning would require much more comprehensive statistics before allowing such a conclusion.
1 Source: Location, location, location. Time, October 21, 1996 (p. 26).
2 Source: One last hope for Bob Dole. Newsweek, October 28, 1996 (p. 6).
Trick or Trap 21
Franklin Roosevelt a Loser?
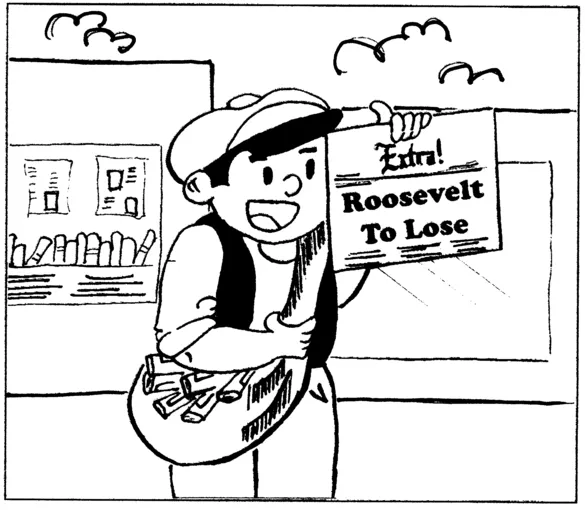
Students of American history know that Franklin Roosevelt was one of the most popular presidents—winning election to the presidency four times in a row. Yet, there was a point in time when many thoughtful people believed that the statistical evidence was running against him.
In a nutshell, here's what happened. The Literary Digest mailed out 10,000,000 questionnaires concerning the 1936 presidential election. About 2,400,000 people responded, and they indicated a clear preference for Alfred Landon, the Republican who was running against Roosevelt in his reelection bid.
Despite the incredible size of the sample contacted and the large number of respondents, the poll was dead wrong. Roosevelt won handily. Why was the poll so inaccurate? Part of the answer lies in how the original 10,000,000 people were selected. The Literary Digest obtained its mailing list primarily from telephone listings and automobile registration lists. Note that in 1936, the country was in the midst of the Great Depression, so telephones and automobiles were not as widespread as they are today. In addition, those who had them tended to be wealthier, and the wealthy tended to be Republican. So the poll was biased since it tended to favor Republicans over Democrats.
The other part of the answer lies in the self-selection of respondents. Only about 24% (2,400,000) of the people responded, that is, they self-selected to respond while others did not. Considerable research on public opinion polling since that time strongly suggests that in response to mailed polls, people from higher socioeconomic status groups are more likely to respond. Thus, the self-selection of respondents (another source of bias) tended to favor the Republicans.
At the same time, other polls, including one conducted by George Gallup using about 56,000 respondents, correctly predicted that Roosevelt would win. These other polls were correct in calling the election because they avoided serious sources of bias such as those in the Literary Digest poll. As you may know, pollsters today conduct national surveys and get rather accurate results using only about 1,500 respondents. This is possible by concentrating on getting a good cross section of the voting population rather than using a large sample. So the lesson is clear: Having a sample that is free of bias is much more important than having a large sample. More concretely, asking millions of the wrong people gives you a wrong answer millions of times over.
While professional polling organizations today go to great lengths to avoid the trap we are considering, if you review the survey research reported in academic journals, it will be easy to find numerous reports on mail surveys to which there are low (self-selected) rates of return. Most of this research is conducted by professors who have limited resources for conducting follow-ups and contacting people in person. In fact, many of them argue that a return rate of 60% or more is "acceptable." Despite this claim, considerable caution should be used in interpreting such reports, keeping in mind that professional polling organizations aim for response rates of 90% or more.1
1 Today, because telephones are in widespread use even among the poor, conducting polls by calling people on the telephone usually results in reasonably accurate results, and usually yields a much higher response rate than mailed questionnaires. Note that pollsters prefer to use "random-digit dialing," that is, dialing numbers selected at random (like drawing names out of a hat) so that even those with unlisted telephone numbers are included in the surveys.
Trick or Trap 22
Bias All Around Us?
If you read Trick or Trap 21, you already appreciate the seriousness with which a bias should be treated when considering the results of surveys. However, you may not realize how pervasive bias in sampling is. Here we'll consider a few examples of different types of bias.
- You've probably all seen polls in magazines, on TV, and on the Internet. All are clearly subject to self-selection, with those most interested in a topic most likely to respond. In addition, only those who self-select to view or read the medium in which the polls appear have a chance to respond. Here's an example of a poll with results that run counter to the best statistical information available on the topic: A major newspaper requested responses on housework and how it is divided between husbands and wives. It reported that "More than half of the 72 replies were glowing tributes to husbands who mop floors, scrub toilets...and more."1 It's probably best to think of such polls as "That's Entertainment." It's great if reading them brings you enjoyment, but keep in mind that they are likely to be highly biased and not a basis for estimating what is going on in the general population.
- There's a saying that "much of what we know about psychology is based on the behavior of college sophomores." This is because students who take introductory psychology are often required to participate in psychological studies. Various types of studies are announced, and students self-select a study in which to participate. Often, an entire line of investigation is based solely on such students. For example, a team of researchers recently conducted a study on lying in various types of relationships. In their introduction, they pointed out that their "community sample" was the first "in the literature on lying in everyday life that is not a group consisting solely of college students."2 Of course, there will be times when psychologists are especially interested in the problems of college students and appropriately study only them. However, when psychologists study broader issues with reference to the general population, their data is contaminated by a bias in favor of college students.
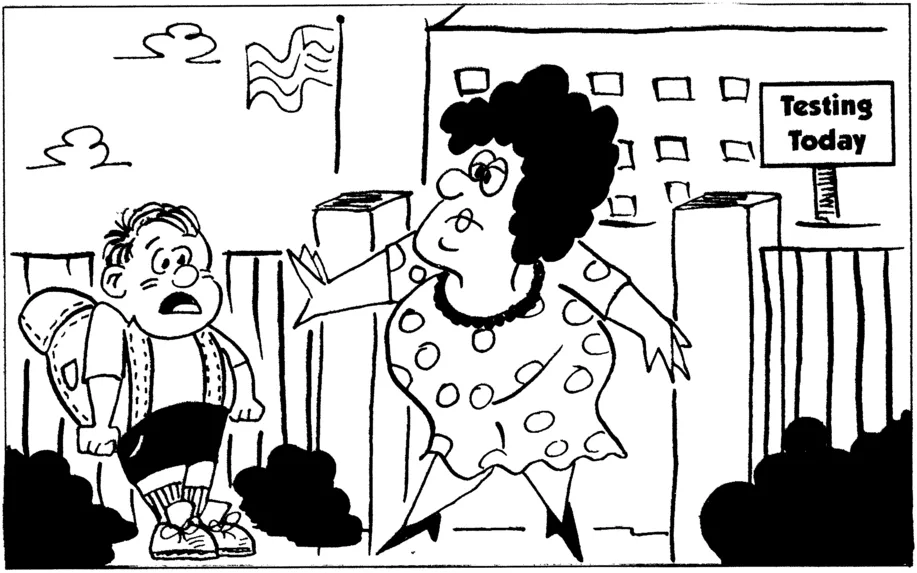
- Finally, there's the possibility of deliberate bias—-where someone deliberately selects respondents who are most likely to support a certain outcome. A recent example was reported by researchers at the University of Minnesota who found that some schools try to keep students with learning disabilities from participating in statewide testi...
Table of contents
- Cover
- Title
- Copyright
- Contents
- Introduction
- Part A Statistical Graphs
- Part B Percentages
- Part C Averages
- Part D Variability
- Part E Definitions
- Part F Assumptions
- Part G Association and Causation
- Part H Confounding
- Part I Sampling
- Part J Measurement
- Part K The Big Picture
Frequently asked questions
Yes, you can cancel anytime from the Subscription tab in your account settings on the Perlego website. Your subscription will stay active until the end of your current billing period. Learn how to cancel your subscription
No, books cannot be downloaded as external files, such as PDFs, for use outside of Perlego. However, you can download books within the Perlego app for offline reading on mobile or tablet. Learn how to download books offline
Perlego offers two plans: Essential and Complete
- Essential is ideal for learners and professionals who enjoy exploring a wide range of subjects. Access the Essential Library with 800,000+ trusted titles and best-sellers across business, personal growth, and the humanities. Includes unlimited reading time and Standard Read Aloud voice.
- Complete: Perfect for advanced learners and researchers needing full, unrestricted access. Unlock 1.5M+ books across hundreds of subjects, including academic and specialized titles. The Complete Plan also includes advanced features like Premium Read Aloud and Research Assistant.
We are an online textbook subscription service, where you can get access to an entire online library for less than the price of a single book per month. With over 1.5 million books across 990+ topics, we’ve got you covered! Learn about our mission
Look out for the read-aloud symbol on your next book to see if you can listen to it. The read-aloud tool reads text aloud for you, highlighting the text as it is being read. You can pause it, speed it up and slow it down. Learn more about Read Aloud
Yes! You can use the Perlego app on both iOS and Android devices to read anytime, anywhere — even offline. Perfect for commutes or when you’re on the go.
Please note we cannot support devices running on iOS 13 and Android 7 or earlier. Learn more about using the app
Please note we cannot support devices running on iOS 13 and Android 7 or earlier. Learn more about using the app
Yes, you can access Statistical Tricks and Traps by Ennis C. Almer,Louie Joseph Cantal,Ennis C Almer in PDF and/or ePUB format, as well as other popular books in Psychology & Research & Methodology in Psychology. We have over 1.5 million books available in our catalogue for you to explore.