![]()
Chapter 1
Introduction to Statistics
Here's an example that illustrates the need for statistics:
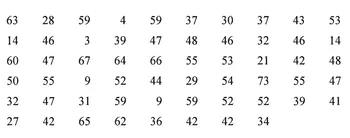
Researchers studied the emotional health of 58 12- to 19-year-old foster care adolescent males who reside in a group home in Virginia. Emotional health was measured by having the adolescents respond to statements such as "Sometimes I feel so ashamed of myself that I just want to hide in a corner and cry" and "I often blame myself even when I am not at fault." Responses were scored so that higher scores indicate better emotional health. The average score for the national standardization group was 50. These scores were obtained for the 58 foster care males:1
As you can see, the researchers have a problem: how can these scores be organized and summarized so that the researchers can concisely discuss the overall emotional health of this group of adolescent males? The problem is compounded by the fact that the researchers measured ten additional variables such as sexual attitudes and impulse control, yielding a total of 638 scores for the 58 adolescents. Clearly, such a large number of scores needs to be summarized in order to produce an intelligible description of the results. We will return to the scores in this example at several points throughout this book to illustrate how descriptive statistics are used to organize and summarize data.
Populations and Samples
A population is the group of interest to a researcher. It may be large, such as all licensed clinical psychologists in the United States, or it may be small, such as all clients served by a social worker. In the example we started with, the population consists of the small number of boys who reside in a foster care home.
When a population is large, we can draw a sample from it, study those in the sample, and generalize the results to the population (that is, infer that what is true of the sample is also true of the population).
Descriptive statistics are used to organize and summarize data whether they come from studies of populations or samples.2 However, another type of statistics called inferential statistics is needed for making generalizations from samples to populations. For example, if a poll of 1,000 registered voters indicates that 55% approve of how the President is handling the economy, inferential statistics can be used to compute a margin of error, which is an allowance for the possible fluctuations due to sampling. Thus, if the margin of error is 4 percentage points, we can be confident that the true percentage of the population who approve is between 51% and 59% (that is, 55% plus and minus 4%). Although inferential statistics perform an important function when we have sampled, they are not needed when we analyze the data of entire populations since there is no sampling error when we do not sample.
Note that each researcher defines a population of interest when planning research. For example, one researcher's population might be all registered nurses in California while another researcher's population might be all registered nurses employed by a specific hospital. Thus, a population may be large or small, depending on the researcher's interest.
Studies of entire populations are more common than you might realize. They are very common in institutional settings such as schools, hospitals, prisons, the military, and corporations. For example, a teacher might measure the reading ability of all third graders in a classroom, and an administrator might measure the same variable for all third graders in the school district. Studies of entire populations are also common when individuals participate in a program that requires them to provide certain information. Examples are people receiving welfare, the clients of a free health clinic, seniors on Medicare, and so on. Thus, those of you who are preparing for jobs in institutional settings or for jobs in which you will be delivering program services will probably find yourselves analyzing population data on the job. Also, you will very likely be required to read various reports on the job that contain descriptive statistics pertaining to the populations you serve. This book will give you a solid foundation in how to perform these tasks.
Scales of Measurement
Researchers measure with a wide variety of measuring tools (known as instruments) such as paper-and-pencil tests, interviews, direct observations of behavior, and self-report questionnaires. The data derived from such instruments may be classified according to scales of measurement. We will consider the nominal, ordinal, and equal interval scales, which will be useful in our discussions in later chapters.
At the nominal level, we classify individuals with words instead of numbers. For example, we might ask people to name their HIV status using these categories: Positive, Negative, and Don't Know; or we might ask people to name their political affiliation with these categories: Democrat, Republican, and Other. Thus, nominal data may be thought of as "naming data." This type of data is also referred to as categorical data.
When we classify individuals by putting them in rank order, we obtain ordinal data. For example, if we rank the students in a class according to their height by giving a rank of 1 to the tallest student, 2 to the next tallest student, and so on, the ranks constitute ordinal data. A fundamental weakness of ordinal data is that they fail to indicate by how much the individuals differ from each other. For example, the student with a rank of 1 on height may be only one-half inch taller than the student with a rank of 2, while the student with a rank of 2 may be three inches taller than the student with a rank of 3. Because of this weakness, we try to limit our use of ordinal data, preferring instead data obtained at the next level.
At the equal interval level, we classify individuals along a numerical continuum that has equal distances among the values. When you examine a ruler, you see equal intervals. The distance between the numbers 1 and 2 is the same as the distance between 2 and 3, and between 3 and 4, and so on. Researchers usually regard test scores as being equal interval. For example, scores on a multiple-choice achievement test are usually assumed to be equal interval. That is, the difference between having 0 right and 1 right on the test is assumed to represent the same amount of achievement as the difference between having 1 right and having 2 right. Likewise, scores on objective measures of attitude, temperament, and personality are usually assumed to be equal interval. For example, if we measure the job satisfaction of social workers using 20 statements to which they respond "true" or "false," we can count how many statements were responded to favorably by each respondent, yielding scores that range from 0 to 20. Likewise, we could let the social workers respond on a 5-point scale from "strongly agree" to "strongly disagree" and obtain a total score for each respondent. Such scores are usually assumed to have equal intervals among them.3
Since the three levels of measurement are referred to at various points in this book, it's a good idea to pause now and master them. Remember:
NOMINAL → naming data
ORDINAL → rank order data
EQUAL INTERVAL → scores with equal intervals
The next chapter describes how to analyze nominal data.
Exercise for Chapter 1
Factual Questions
A county sheriff is interested in determining the HIV status of all inmates in the county jail. If he examines the records of all inmates to determine the number who reported that they are HIV+, the sheriff is studying a
A. population. B. sample.
Descriptive statistics are used to organize and summarize data obtained from
A. samples only. B. populations only.
C. both samples and populations.
A city health official examined the coroner's records to determine how many men and women in a city died of sudden cardiac arrest during a recent year. To the best of her knowledge, the records are complete and accurate for the population. Does she need to use inferential statistics to interpret the data?
A. yes B. no
Are all populations large?
A. yes B. no
If the science projects of the five finalists in a contest in a school district are ranked from 1 to 5, which scale of measurement is being used?
A. nominal B. ordinal C. equal interval
If respondents in a survey are asked to name their state of residence, which scale of measurement is being used?
A. nominal B. ordinal C. equal interval
Scores obtained by using an objective multiple-choice test are usually classified as belonging to which scale of measurement?
A. nominal B. ordinal C. equal interval
Questions for Discussion
- 8. Name a population that you might need to study on the job in either your current or future occupation. Would you be able to study it without sampling? Explain,
- 9. Name a variable other than those mentioned in this chapter that, when measured, would yield nominal data.
![]()
Chapter 2
Percentages and Bar Graphs
As you recall from the previous chapter, nominal data are "naming data." For example, the foster care adolescents whom we considered in Chapter 1 were asked to name their race, and 12 said ...