Latent Variable Models: An Introduction to Factor, Path, and Structural Equation Analysis introduces latent variable models by utilizing path diagrams to explain the relationships in the models. This approach helps less mathematically-inclined readers to grasp the underlying relations among path analysis, factor analysis, and structural equation modeling, and to set up and carry out such analyses. This revised and expanded fifth edition again contains key chapters on path analysis, structural equation models, and exploratory factor analysis. In addition, it contains new material on composite reliability, models with categorical data, the minimum average partial procedure, bi-factor models, and communicating about latent variable models.
The informal writing style and the numerous illustrative examples make the book accessible to readers of varying backgrounds. Notes at the end of each chapter expand the discussion and provide additional technical detail and references. Moreover, most chapters contain an extended example in which the authors work through one of the chapter's examples in detail to aid readers in conducting similar analyses with their own data. The book and accompanying website provide all of the data for the book's examples as well as syntax from latent variable programs so readers can replicate the analyses. The book can be used with any of a variety of computer programs, but special attention is paid to LISREL and R.
An important resource for advanced students and researchers in numerous disciplines in the behavioral sciences, education, business, and health sciences, Latent Variable Models is a practical and readable reference for those seeking to understand or conduct an analysis using latent variables.
Trusted by 375,005 students
Access to over 1.5 million titles for a fair monthly price.
Chapter 1: Path Models in Factor, Path, and Structural Equation Analysis
Scientists dealing with behavior, especially those who observe it occurring in its natural settings, rarely have the luxury of the simple bivariate experiment, in which a single independent variable is manipulated and the consequences observed for a single dependent variable. Even those scientists who think they do are often mistaken: The variables they directly manipulate and observe are typically not the ones of real theoretical interest but are merely some convenient variables acting as proxies or indexes for them. A full experimental analysis would again turn out to be multivariate, with a number of alternative experimental manipulations on the one side, and a number of alternative response measures on the other.
Over many years, numerous statistical techniques have been developed for dealing with situations in which multiple variables, some unobserved, are involved. Such techniques often involve large amounts of computation. Until the advent of powerful digital computers and associated software, the use of these methods tended to be restricted to the dedicated few. But in the last few decades it has been feasible for any interested behavioral scientists to take a multivariate approach to their data. Many have done so. The explosive growth in the use of computer software packages such as SPSS, SAS, and R is one evidence of this.
The common features of the methods discussed in this book are that (a) multiple variables—three or more—are involved, and that (b) one or more of these variables is unobserved, or latent. Neither of these criteria provides a decisive boundary. Bivariate methods may often be regarded as special cases of multivariate methods. Some of the methods we discuss can be—and often are—applied in situations where all the variables are, in fact, observed. Nevertheless, the main focus of our interest is on what we call, following Bentler (1980), latent variable analysis, a term encompassing such specific methods as factor analysis, path analysis, and structural equation modeling (SEM), all of which share these defining features.
Path Diagrams
An easy and convenient representation of the relationships among a number of variables is the path diagram. In such a diagram we use capital letters, A, B, X, Y, and so on, to represent variables. The connections among variables are represented in path diagrams by two kinds of arrows: a straight, one-headed arrow represents a causal relationship between two variables, and a curved two-headed arrow represents a simple correlation between them.
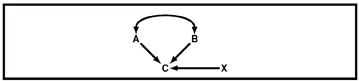
Fig. 1.1 shows an example of a path diagram. Variables A, B, and X all are assumed to have causal effects on variable C. Variables A and B are assumed to be correlated with each other. Variable X is assumed to affect C but to be uncorrelated with either A or B. Variable C might (for example) represent young children’s intelligence. Variables A and B could represent father’s and mother’s intelligence, assumed to have a causal influence on their child’s intelligence. (The diagram is silent as to whether this influence is environmental, genetic, or both.) The curved arrow between A and B allows for the likely possibility that father’s and mother’s intelligence will be correlated. Arrow X represents the fact that there are other variables, independent of mother’s and father’s intelligence, that can affect a child’s intelligence.
Figure 1.1 Example of a simple path diagram.
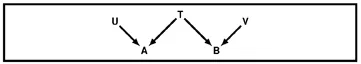
Fig. 1.2 shows another example of a path diagram. T is assumed to affect both A and B, and each of the latter variables is also affected by an additional variable; these are labeled U and V, respectively. This path diagram could represent the reliability of a test, as described in classical psychometric test theory. A and B would stand (say) for scores on two alternate forms of a test. T would represent the unobserved true score on the trait being measured, which is assumed to affect the observed scores on both forms of the test. U and V would represent factors specific to each form of the test or to the occasions on which it was administered, which would affect any given performance but be unrelated to the true trait. (In classical psychometric test theory, the variance in A and B resulting from the influence of T is called true score variance, and that caused by U or V is called error variance. The proportion of the variance of A or B due to T is called the reliability of the test.)
Figure 1.2 Another path diagram: test reliability.
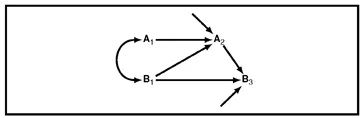
Figure 1.3 A path diagram involving events over time.
Fig. 1.3 shows a path representation of events over time. In this case, the capital letters A and B are used to designate two variables, with subscripts to identify the occasions on which they are measured: Both A and B are measured at time 1, A is measured again at time 2, and B at time 3. In this case, the diagram indicates that both A1 and B1 are assumed to affect A2, but that the effect of A1 on B at time 3 is wholly via A2—there is no direct arrow drawn leading from A1 to B3. It is assumed that A1 and B1 are correlated, and that A2 and B3 are subject to additional influences independent of A and B, here represented by short, unlabeled arrows. These additional influences could have been labeled, say, X and Y, but are often left unlabeled in path diagrams, as here, to indicate that they refer to other, unspecified influences on the variable to which they point. Such arrows are called residual arrows to indicate that they represent causes residual to those explicitly identified in the diagram.
The meaning of “cause” in a path diagram
Straight arrows in path diagrams are said to represent causal relationships—but in what sense of the sometimes slippery word “cause”? In fact, we do not need to adopt any strict or narrow definition of cause in this book, because path diagrams can be—and are—used to represent causes of various kinds, as the examples we have considered suggest. The essential feature for the use of a causal arrow in a path diagram is the assumption that a change in the variable at the tail of the arrow will result in a change in the variable at the head of the arrow, all else being equal (i.e., with all other variables in the diagram held constant). Note the one-way nature of this process—imposing a change on the variable at the head of the arrow does not bring about a change in the tail variable. A variety of common uses of the word “cause” can be expressed in these terms, and hence can legitimately be represented by a causal arrow in a path diagram.
Completeness of a path diagram
Variables in a path diagram may be grouped in two classes: those that do not receive causal inputs from any other variable in the path diagram, and those that receive one or more such causal inputs. Variables in the first of these two classes are referred to as exogenous, independent, or source variables. Variables in the second class are called endogenous, dependent, or downstream variables. Exogenous variables(Greek: “of external origin”) are so called because their causal sources lie external to the path diagram; they are causally independent with respect to other variables in the diagram—straight arrows may lead away from them but never toward them. These variables represent causal sources in the diagram. Examples of such source variables in Fig. 1.3 are A1, B1, and the two unlabeled residual variables. Endogenous variables(“of internal origin”) have at least some causal sources that lie within the path diagram; these variables are causally dependent on other variables—one or more straight arrows lead into them. Such variables lie causally downstream from source ...
Table of contents
Cover
Half Title
Title Page
Copyright Page
Table of Contents
Preface
Chapter 1: Path Models in Factor, Path, and Structural Equation Analysis
Chapter 2: Fitting Path Models
Chapter 3: Fitting Path and Structural Models to Data from a Single Group on a Single Occasion
Chapter 4: Fitting Models Involving Repeated Measures, Multiple Groups, or Means
Chapter 7: Issues in the Application of Latent Variable Models
Appendices
Answers to Exercises
References
Index
Frequently asked questions
Yes, you can cancel anytime from the Subscription tab in your account settings on the Perlego website. Your subscription will stay active until the end of your current billing period. Learn how to cancel your subscription
No, books cannot be downloaded as external files, such as PDFs, for use outside of Perlego. However, you can download books within the Perlego app for offline reading on mobile or tablet. Learn how to download books offline
Perlego offers two plans: Essential and Complete
Essential is ideal for learners and professionals who enjoy exploring a wide range of subjects. Access the Essential Library with 800,000+ trusted titles and best-sellers across business, personal growth, and the humanities. Includes unlimited reading time and Standard Read Aloud voice.
Complete: Perfect for advanced learners and researchers needing full, unrestricted access. Unlock 1.5M+ books across hundreds of subjects, including academic and specialized titles. The Complete Plan also includes advanced features like Premium Read Aloud and Research Assistant.
Both plans are available with monthly, semester, or annual billing cycles.
We are an online textbook subscription service, where you can get access to an entire online library for less than the price of a single book per month. With over 1.5 million books across 990+ topics, we’ve got you covered! Learn about our mission
Look out for the read-aloud symbol on your next book to see if you can listen to it. The read-aloud tool reads text aloud for you, highlighting the text as it is being read. You can pause it, speed it up and slow it down. Learn more about Read Aloud
Yes! You can use the Perlego app on both iOS and Android devices to read anytime, anywhere — even offline. Perfect for commutes or when you’re on the go. Please note we cannot support devices running on iOS 13 and Android 7 or earlier. Learn more about using the app
Yes, you can access Latent Variable Models by John C. Loehlin,A. Alexander Beaujean,Alexander Beaujean in PDF and/or ePUB format, as well as other popular books in Psychology & Education Theory & Practice. We have over 1.5 million books available in our catalogue for you to explore.