The first part of this book discusses institutions and mechanisms of algorithmic trading, market microstructure, high-frequency data and stylized facts, time and event aggregation, order book dynamics, trading strategies and algorithms, transaction costs, market impact and execution strategies, risk analysis, and management. The second part covers market impact models, network models, multi-asset trading, machine learning techniques, and nonlinear filtering. The third part discusses electronic market making, liquidity, systemic risk, recent developments and debates on the subject.

eBook - ePub
Quantitative Trading
Algorithms, Analytics, Data, Models, Optimization
- 357 pages
- English
- ePUB (mobile friendly)
- Available on iOS & Android
eBook - ePub
Quantitative Trading
Algorithms, Analytics, Data, Models, Optimization
About this book
Trusted by 375,005 students
Access to over 1.5 million titles for a fair monthly price.
Study more efficiently using our study tools.
1
Introduction
This chapter gives an overview and some historical background of quantitative trading, the title of this book. It begins with a historical review of the evolution of the trading infrastructure, from verbal communication and hand signaling in an exchange to electronic platforms, in Section 1.1. It then gives in Section 1.2 an introduction to quantitative trading strategies and in particular, the time-scales associated with different classes of strategies. In this connection, we give in Section 1.3 a brief historical account of the paradigm shift from the “efficient market hypothesis” (EMH) to arbitrage opportunities via quantitative trading. In Section 1.4, we describe “quant funds” that use these quantitative trading strategies, and also the closely related mutual funds and hedge funds. An overview of the algorithms, analytics, data, models, and optimization methods — the subtitle of this book — used in quantitative trading is given in Section 1.5. Section 1.6 discusses the interdisciplinary background of the book and the anticipated diversity of its target audience. It also provides suggestions on how the book can be used by different groups of readers. Supplements and problems are given in Section 1.7.
1.1Evolution of trading infrastructure
From the perspective of economics, a stock exchange is basically a double auction system. Bids and offers are made in a stock exchange giving all participants a chance to compete for the order with the best price, analogous to an auction that results in “efficient price discovery”. Before the advent of electronic trading platforms, trading floors (or “trading pits”) were the venues where buyers and sellers of stocks and bonds (or futures and options) gathered at an exchange to trade. Open outcry was a method of communication, involving shouting and use of hand signals to transfer information about buy and sell orders. The hand signals used to communicate information in an open outcry environment consist of palm facing out and hands away from the body to gesture wishes to sell, and palms facing in and hands holding up to gesture wishes to buy; see Figure 1.1. Open outcry differs from a typical auction system that has a clear price-time priority because it allows multiple participants to respond to a bid or offer and they may each get a piece of the resulting trade.
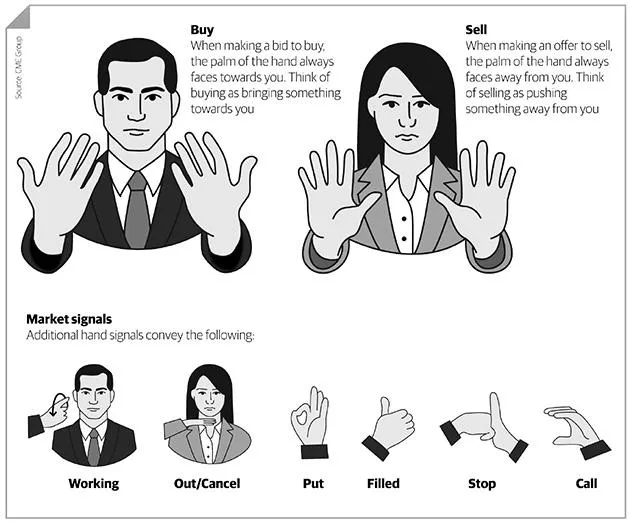
FIGURE 1.1: Hand signals for trading in an open outcry system. (Used with permission of CME.)
Major advances in information technology in the 1980s led to electronic trading platforms that made buy and sell transactions easier to complete, monitor, clear and settle than the open outcry system. The NASDAQ, founded by the National Association of Securities Dealers (NASD) in 1971, is the world’s first electronic stock market although it was initially only a computer bulletin board (with “automatic quotations” or AQ) and did not actually connect buyers and sellers. Until 1987, most trading of NASDAQ stocks proceeded via the telephone. On the other hand, Instinet was the first electronic communication network (ECN) that started electronic trading among institutional clients in 1969. The platform grew rapidly in the mid-1980s and became the dominant ECN by the time the US Securities and Exchange Commission (SEC) introduced the Order Handling Rules and ATS (alternative trading systems) regulation in the late 1990s. The London Stock Exchange moved to electronic trading in 1986. In 1992, the Chicago Mercantile Exchange (CME) launched its electronic trading platform Globex, which was conceived in 1987, allowing access to a variety of financial markets including treasuries, foreign exchanges and commodities. The Chicago Board of Trade (CBOT) developed a rival system based on an electronic platform branded “E Open Outcry” allowing electronic trading to take place alongside that in the CBOT pits. The Toronto Stock Exchange adopted electronic trading in 1997. The New York Mercantile Exchange (NYMEX) switched to electronic trading by using the Globex platform in 2006, after losing market share in oil futures trading to the electronic-based Intercontinental Exchange (ICE). The New York Stock Exchange (NYSE) moved to electronic trading in 2006.
Before the wide adoption of electronic exchange trading platforms, transacted prices, rather than bid and offer prices, were the most accurate data because of their recording for settlement. The real-time transactions data were delivered from the trading pits to the “public” by stock tickers: machines which printed abbreviated company names as alphabetic symbols followed by numeric stock transaction price and volume information. As noted by Powers (1966) about the “old world of trading floors”, traders shouted out bids or offers and acceptances of a bid or offer. They recorded details of these trades on special trading cards, and this information would then be keypunched into the exchange’s clearing system. “If any one of these trade descriptors didn’t match, the system rejected them as an out trade, a trade that did not match and did not stand until the two parties resolved the differences.” Out trades were considered a cost of trading, and “some exchanges would impose penalties on clearing firms if the percent of their trades that resulted in out trades exceeded a certain level.”

FIGURE 1.2: Stock ticker manufactured by Western Union Telegraph Company in the 1870s and now an exhibit at the Computer History Museum in Mountain View, California. Originally, only transacted prices and abbreviated stock symbols were printed on the ticker tape; after the 1930s, traded volume was also printed. (Photo credit: Wikimedia Commons/Don DeBold.)
Electronic trading (sometimes called “etrading”) platforms are typically proprietary software running on COTS (commercial off the shelf) operating systems, often using common communications protocols for the Internet and similar networks such as TCP/IP. Exchanges typically develop their own systems and offer two methods to access their systems: (a) an exchanged-provided graphic user interface (GUI) allowing traders to connect and run on their own desktops, and (b) an application programming interface (API) allowing dealers to connect their in-house systems directly to the exchange. Most exchanges provide gateways that sit on a company’s network to connect to the exchange’s system. Investment firms on both the buy side and the sell side have considerably more complex technology requirements since they have to deal with multiple exchanges and counterparties, and have been increasing their spending on technology for electronic trading while removing floor traders and executing traders in stocks, bonds, foreign exchanges and financial derivatives. They have increasingly relied on algorithms to analyze markets and then execute their orders electronically.
One important advantage of electronic trading is the reduced cost of transactions. Transaction costs are an important consideration in trading strategies although they are often assumed to be negligible in classical financial theories of investment and option pricing; see Lai and Xing (2008, p. 183, 300). Incorporating transaction costs introduces much greater complexity into these theories. Some recent developments in this area will be described in Chapter 3. Through “straight-through processing” (STP) of trades in electronic platforms, transaction costs can be brought down to the extent that increased trading volumes do not result in significantly larger transaction costs, thereby increasing the returns for the trades. Other improvements provided by electronic platforms are increased liquidity due to more buyers and sellers in a financial market and increased transparency of the market because the information of the bid and ask prices of securities flows around the world electronically. Since one can trade on a computer at the click of a button and does not need to go through a broker or pass orders to a trader on the exchange floor, electronic trading has removed some major barriers to global investing. Another important impact of electronic platforms is tighter spreads for market makers. The “spread” on a trade is the difference between the best buy and sell prices being quoted and represents the profit made by the market makers.
The move to electronic trading continues to increase not only in major exchanges around the world but also in business-to-business (B2B) and business-to-consumers (B2C) trading. In B2C trading, retail and institutional clients buy and sell from brokers (dealers) who act as intermediaries between the clients and the B2B markets. Institutional clients include hedge funds, fund managers and insurance companies trading large amounts of securities, while retail clients are typically individuals buying and selling relatively small amounts. Many retail brokers (e.g., Charles Schwab, E-Trade) went online in the late 1990s and the majority of retail trading in the US has moved from over the phone to electronic transactions. Large institutional clients usually place electronic orders via proprietary electronic trading platforms such as Bloomberg Terminal, Reuters 300Xtra, Thomson TradeWeb, or their broker’s proprietary software. In B2B trading, large investment banks and brokers trade directly with one another, transacting large amounts of securities. Connecting counterparties through electronic trading is supported by the FIX (Financial Information eXchange) Protocol, which is the industry standard for pre-trade messaging and trade execution. The protocol was initially developed for trading stocks, and subsequently enhanced to trade commodities, currencies, derivatives, and fixed income securities.
1.2Quantitative strategies and time-scales
Quantitative trading strategies are investment strategies based on quantitative analysis of financial markets and prediction of future performance. The strategy and associated predictions depend on the time-scale of the investment, as exemplified by the following classes of quantitative strategies.
•Fundamentally motivated quant (FMQ): The popular strategy of buying a stock if it is undervalued with respect to fundamentals is an FMQ. Since its associated fundamentals are based on quarterly earning reports and forecasts, the FMQ has a quarterly time-scale. Some common themes in the analysis of fundamentals are earning quality, value of the firm, and investor sentiment.
•Systematic macro: Macro strategies use macroeconomic analysis of market events and trends to identify opportunities for investment. They can be divided into discretionary and systematic strategies, with the discretionary ones carried out by investment managers who identify and select the investments. Systematic macro strategies are model-based and executed by software with limited human involvement. An example is to buy US dollars if the macroeconomic analysis suggests a rising trend for the dollar. Since the Federal Reserve Bank has to hold collaterals mainly in US Treasury debts and since the shortest maturity of Treasury bills is 28 days (about a month), the above systematic macro has a monthly time scale.
•Convergence or relative value trades and other statistical arbitrage (StatArb) strategies: Convergence trades refer to trading in similar assets that are expected to converge in value. For example, the most recently issued (called “on the run”) 30-year US Treasury bond generally trades at a liquidity premium relative to the -year bond because it is more liquid. After a few months when a new 30-year bond is issued, the old bonds are now both off the run, resulting in decrease of the liquidity premium. Hence by selling the 30-year bond short and buying the -year bond, one can potentially benefit from a change from the liquidity premium by waiting a few months. Relative value strategies likew...
Table of contents
- Cover
- Half Title
- Title Page
- Copyright Page
- Dedication
- Table of Contents
- Preface
- List of Figures
- List of Tables
- 1 Introduction
- 2 Statistical Models and Methods for Quantitative Trading
- 3 Active Portfolio Management and Investment Strategies
- 4 Econometrics of Transactions in Electronic Platforms
- 5 Limit Order Book: Data Analytics and Dynamic Models
- 6 Optimal Execution and Placement
- 7 Market Making and Smart Order Routing
- 8 Informatics, Regulation and Risk Management
- A Martingale Theory
- B Markov Chain and Related Topics
- C Doubly Stochastic Self-Exciting Point Processes
- D Weak Convergence and Limit Theorems
- Bibliography
- Index
Frequently asked questions
Yes, you can cancel anytime from the Subscription tab in your account settings on the Perlego website. Your subscription will stay active until the end of your current billing period. Learn how to cancel your subscription
No, books cannot be downloaded as external files, such as PDFs, for use outside of Perlego. However, you can download books within the Perlego app for offline reading on mobile or tablet. Learn how to download books offline
We are an online textbook subscription service, where you can get access to an entire online library for less than the price of a single book per month. With over 1.5 million books across 990+ topics, we’ve got you covered! Learn about our mission
Look out for the read-aloud symbol on your next book to see if you can listen to it. The read-aloud tool reads text aloud for you, highlighting the text as it is being read. You can pause it, speed it up and slow it down. Learn more about Read Aloud
Yes! You can use the Perlego app on both iOS and Android devices to read anytime, anywhere — even offline. Perfect for commutes or when you’re on the go.
Please note we cannot support devices running on iOS 13 and Android 7 or earlier. Learn more about using the app
Please note we cannot support devices running on iOS 13 and Android 7 or earlier. Learn more about using the app
Yes, you can access Quantitative Trading by Xin Guo,Tze Leung Lai,Howard Shek,Samuel Po-Shing Wong in PDF and/or ePUB format, as well as other popular books in Business & Finance. We have over 1.5 million books available in our catalogue for you to explore.