eBook - ePub
Discrete Data Analysis with R
Visualization and Modeling Techniques for Categorical and Count Data
- 562 pages
- English
- ePUB (mobile friendly)
- Available on iOS & Android
eBook - ePub
Discrete Data Analysis with R
Visualization and Modeling Techniques for Categorical and Count Data
About this book
An Applied Treatment of Modern Graphical Methods for Analyzing Categorical DataDiscrete Data Analysis with R: Visualization and Modeling Techniques for Categorical and Count Data presents an applied treatment of modern methods for the analysis of categorical data, both discrete response data and frequency data. It explains how to use graphical meth
Trusted by 375,005 students
Access to over 1.5 million titles for a fair monthly price.
Study more efficiently using our study tools.
Information
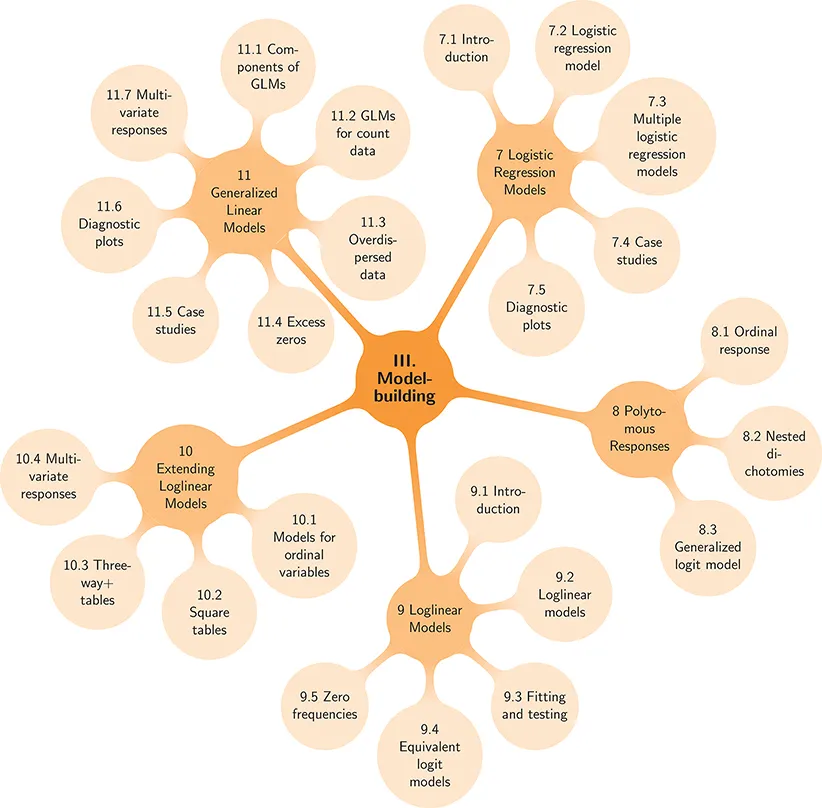
Part III
Model-Building Methods
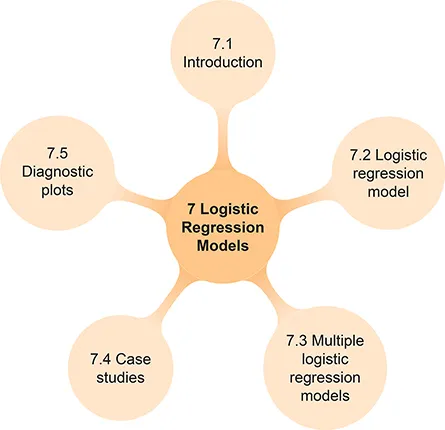
7
Logistic Regression Models
This chapter introduces the modeling framework for categorical data in the simple situation where we have a categorical response variable, often binary, and one or more explanatory variables. A fitted model provides both statistical inference and prediction, accompanied by measures of uncertainty. Data visualization methods for discrete response data must often rely on smoothing techniques, including both direct, non-parametric smoothing and the implicit smoothing that results from a fitted parametric model. Diagnostic plots help us to detect influential observations that may distort our results.
7.1 Introduction
All models are wrong, but some are useful.
Chapter 4, Chapter 5, Chapter 6 have been concerned primarily with simple exploratory methods for studying the relations among categorical variables and with testing hypotheses about their associations through non-parametric tests and with overall goodness-of-fit statistics.
This chapter begins our study of model-based methods for the analysis of discrete data. These models differ from those we have examined earlier primarily in that they consider explicitly an assumed probability distribution for the observations, and make clear distinctions between the systematic component, which is explained by the model, and the random component, which is not. More importantly, the model-based approach allows a compact summary of categorical data in terms of a (hopefully) small number of parameters accompanied by measures of uncertainty (standard errors), and the ability to estimate predicted values over the range of explanatory variables.
This model-fitting approach has several advantages: (a) Inferences for the model parameters include both hypothesis tests and confidence intervals. (b) The former help us to assess which explanatory variables affect the outcome; the size of the estimated parameters and the widths of their confidence intervals help us to assess the strength and importance of these effects. (c) There are a variety of methods for model selection, designed to help determine a favorable trade-off between goodness-of-fit and parsimony. (d) Finally, the predicted values obtained from the model effectively smooth the discrete responses, allow predictions for unobserved values of the explanatory variables, and provide important means to interpret the fitted relationship graphically.
Figure 7.1 provides a visual overview of the steps for fitting and graphing with model-based methods in R. (a) A modeling function such as
glm() is applied to an input data frame. The result is a model object containing all the information from the fitting process. (b) As is standard in R, print() and summary() methods give, respectively, basic and detailed printed output. (c) Many modeling functions have plot() methods that produce different types of summary and diagnostic plots. (d) For visualizing the fitted model, most model methods provide a predict() method that can be used to plot the fitted values from the model over the ranges of the predictors. Such plots can be customized by the addition of points (showing the observations), lines, confidence bands, and so forth.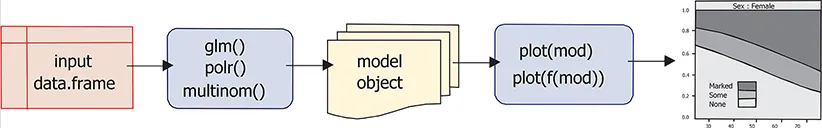
Figure 7.1: Overview of fitting and graphing for model-based methods in R.
In this chapter we consider models for a binary response, such as “success” or “failure,” or the number of “successes” in a fixed number of “trials,” where we might reasonably assume a binomial distribution for the random component. As we will see in Chapter 8, these methods extend readily to a polytomous response with more than two outcome categories, such as improvement in therapy, with categories “none,” “some,” and “marked.”
These models can be seen as simple extensions of familiar ANOVA and regression models for quantitative data. They are also important special cases of a more gen...
Table of contents
- Cover
- Half Title
- Series Page
- Title Page
- Copyright Page
- Table of Contents
- Preface
- I Getting Started
- II Exploratory and Hypothesis-Testing Methods
- III Model-Building Methods
- References
- Author Index
- Example Index
- Subject Index
Frequently asked questions
Yes, you can cancel anytime from the Subscription tab in your account settings on the Perlego website. Your subscription will stay active until the end of your current billing period. Learn how to cancel your subscription
No, books cannot be downloaded as external files, such as PDFs, for use outside of Perlego. However, you can download books within the Perlego app for offline reading on mobile or tablet. Learn how to download books offline
Perlego offers two plans: Essential and Complete
- Essential is ideal for learners and professionals who enjoy exploring a wide range of subjects. Access the Essential Library with 800,000+ trusted titles and best-sellers across business, personal growth, and the humanities. Includes unlimited reading time and Standard Read Aloud voice.
- Complete: Perfect for advanced learners and researchers needing full, unrestricted access. Unlock 1.5M+ books across hundreds of subjects, including academic and specialized titles. The Complete Plan also includes advanced features like Premium Read Aloud and Research Assistant.
We are an online textbook subscription service, where you can get access to an entire online library for less than the price of a single book per month. With over 1.5 million books across 990+ topics, we’ve got you covered! Learn about our mission
Look out for the read-aloud symbol on your next book to see if you can listen to it. The read-aloud tool reads text aloud for you, highlighting the text as it is being read. You can pause it, speed it up and slow it down. Learn more about Read Aloud
Yes! You can use the Perlego app on both iOS and Android devices to read anytime, anywhere — even offline. Perfect for commutes or when you’re on the go.
Please note we cannot support devices running on iOS 13 and Android 7 or earlier. Learn more about using the app
Please note we cannot support devices running on iOS 13 and Android 7 or earlier. Learn more about using the app
Yes, you can access Discrete Data Analysis with R by Michael Friendly,David Meyer in PDF and/or ePUB format, as well as other popular books in Mathematics & Probability & Statistics. We have over 1.5 million books available in our catalogue for you to explore.