Essentials of Economics in Context
eBook - ePub

Essentials of Economics in Context

Neva Goodwin, Jonathan M. Harris, Pratistha Joshi Rajkarnikar, Brian Roach, Tim B. Thornton

Share book
  1. 600 pages
  2. English
  3. ePUB (mobile friendly)
  4. Available on iOS & Android
eBook - ePub

Essentials of Economics in Context

Neva Goodwin, Jonathan M. Harris, Pratistha Joshi Rajkarnikar, Brian Roach, Tim B. Thornton

Book details
Book preview
Table of contents
Citations

About This Book

Essentials of Economics in Context is specifically designed to meet the requirements of a one-semester introductory economics course that provides coverage of both microeconomic and macroeconomic foundations. It addresses current economic challenges, paying specific attention to issues of inequality, globalization, unpaid work, technology, financialization, and the environment, making the text a genuinely twenty-first century introduction to economics.

Aspects of history, institutions, gender, ethics, and ecology are integrated throughout the text, and economic analysis is presented within broader themes of human well-being, and social and environmental sustainability. Theoretical expositions in the text are kept close to reality by integrating numerous real-world examples and by presenting the material in the recognized accessible and engaging style of this experienced author team.

Key features of Essentials of Economics in Context include:

• an inclusive approach to economics, where the economy is analyzed within its social and environmental context

• an innovative chapter examining data on various economic indicators

• focus on goals of human well-being, stability, and sustainability, and inclusion of core and public

purpose spheres, instead of solely focusing on market activities

  • a wealth of online materials such as slides, test banks, and answers to exercises in the book

This text is the ideal resource for one-semester introductory economics courses globally.

The book's companion website is available at: http://www.bu.edu/eci/education-materials/textbooks/essentials-of-economics-in-context/

Frequently asked questions

How do I cancel my subscription?
Simply head over to the account section in settings and click on “Cancel Subscription” - it’s as simple as that. After you cancel, your membership will stay active for the remainder of the time you’ve paid for. Learn more here.
Can/how do I download books?
At the moment all of our mobile-responsive ePub books are available to download via the app. Most of our PDFs are also available to download and we're working on making the final remaining ones downloadable now. Learn more here.
What is the difference between the pricing plans?
Both plans give you full access to the library and all of Perlego’s features. The only differences are the price and subscription period: With the annual plan you’ll save around 30% compared to 12 months on the monthly plan.
What is Perlego?
We are an online textbook subscription service, where you can get access to an entire online library for less than the price of a single book per month. With over 1 million books across 1000+ topics, we’ve got you covered! Learn more here.
Do you support text-to-speech?
Look out for the read-aloud symbol on your next book to see if you can listen to it. The read-aloud tool reads text aloud for you, highlighting the text as it is being read. You can pause it, speed it up and slow it down. Learn more here.
Is Essentials of Economics in Context an online PDF/ePUB?
Yes, you can access Essentials of Economics in Context by Neva Goodwin, Jonathan M. Harris, Pratistha Joshi Rajkarnikar, Brian Roach, Tim B. Thornton in PDF and/or ePUB format, as well as other popular books in Economía & Macroeconomía. We have over one million books available in our catalogue for you to explore.

Information

Publisher
Routledge
Year
2020
ISBN
9781000067125
Edition
1

Part I
The Context for Economic Analysis

Chapter 0
Economics and Well-Being

What comes to your mind when you think of the word “economics”? Perhaps you think about things like money, the stock market, unemployment, gross domestic product (GDP), and supply and demand. These things are definitely important in our study of economics, and we will spend much of our time in this book studying these concepts.
But the goals of economics are about much more than these. As we will see in Chapter 1, economics is the study of how people manage their resources to meet their needs and enhance their well-being. The term “well-being” can mean different things to different people. Traditional economic indicators like growth, income, inflation, and unemployment clearly affect our well-being. But so does our health, the quality of our environment, our leisure time, our perceptions of fairness and justice, and many other factors. In this book, we will take an inclusive approach to well-being. Our study of economics will help you better understand many of the policies and outcomes we observe and think about ways that we might be able to improve things. Many of the topics that we will study relate to current economic and political debates, such as economic inequality, the environment, taxes, and globalization.
The purpose of this introductory chapter is to provide an overview of many of the topics we will cover in more detail later in the book. You may find some of this information surprising. Sometimes data-based results differ from common perceptions and media representations. But we have tried to be as objective as possible by presenting a wide range of data from reliable sources. Good data are essential for informed debates about how to enhance well-being in our communities.
The information in this chapter is divided into two sections:
  1. Time trends graphs presenting time-series data that show how a particular variable changes over time; and
  2. Bar graphs presenting cross-sectional data that show observations on a particular variable for many subjects (such as individuals, firms, countries, or regions) at one point in time. In this chapter, we look at cross-sectional data for different countries to make international comparisons on specific economic variables, but you will see similar graphs comparing individuals or firms at several points in the book. While we mainly focus on the United States here, and in much of the rest of the book, it is important to see individual country data within the global context. If you are interested in the performance of specific countries we have not included here, detailed tables are available on the book’s companion website: www.bu.edu/eci.
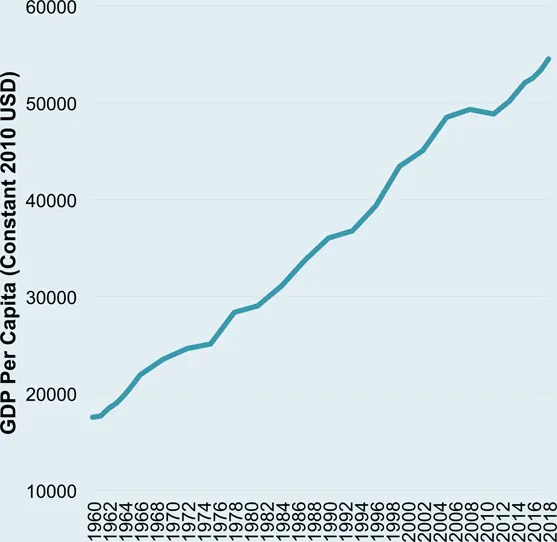
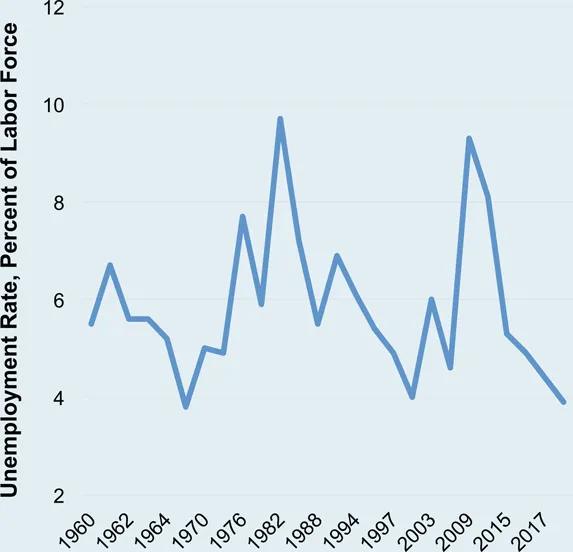
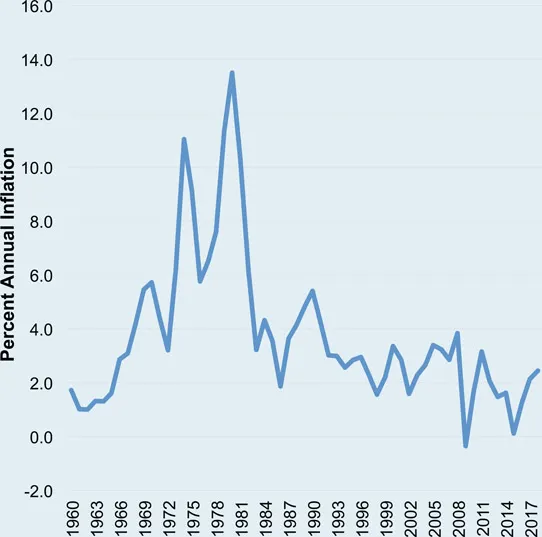
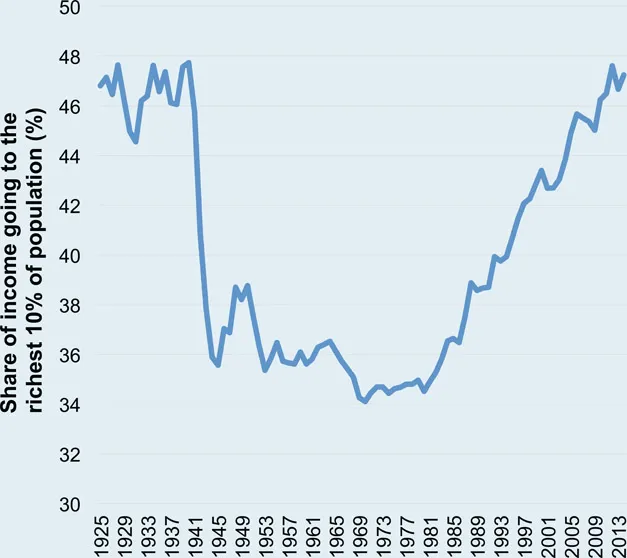
time-series data: observations of how a numerical variable changes over time
cross-sectional data: observations on a variable for different subjects at one point in time
The graphs that appear in this chapter are:

Time Trend Graphs

  1. U.S. GDP per Capita
  2. U.S. Unemployment Rate
  3. U.S. Inflation Rate
  4. U.S. Income Inequality
  5. Gender-Based Earnings Inequality
  6. Global International Trade
  7. Global Carbon Dioxide Emissions

Bar Graphs: International Comparisons

  1. GDP per Capita
  2. Unemployment Rate
  3. Inflation Rate
  4. Trade Balance
  5. Income Inequality
  6. Absolute Poverty
  7. Educational Performance
  8. Life Expectancy
  9. Carbon Dioxide Emissions per Capita
International comparison rankings are based on the available data, including the highest and lowest values for each variable. While there are over 200 countries in the world, data are not available for all countries for each variable, so the number of countries ranked for each variable differs.1 The countries shown here have been chosen to convey the full range of results, with a focus on the United States (the U.S. results are always highlighted). Major countries, such as China, India, and the United Kingdom, are also included in most figures. Country rankings are provided based on the available data, with the “highest” rank at the top and the “lowest” at the bottom. However, this does not always mean that it is best to be at the top. For example, we present graphs showing unemployment rate, the percentage of people living in absolute poverty, and carbon dioxide emissions per capita. Obviously, it is not a good thing to be ranked first (the highest) for these variables.
BOX 0.1 U.S. GDP PER CAPITA
What it is: GDP, or gross domestic product, is a measure of the total value of goods and services produced in a country. As discussed in Chapter 8, GDP is widely used as a measure of a nation’s economic development. However, GDP only measures market activities and ignores aspects such as health, education, inequality, and environmental sustainability that are central to economic well-being. Hence, using GDP as a measure of well-being is highly controversial. GDP per capita, shown here, is GDP divided by the country’s population, and the time trend of GDP per capita shows how average income changes over time.
The results: U.S. GDP per capita has increased more than threefold since 1960. The progression has not been entirely smooth, with pauses and declines, especially during periods of economic recession, but the overall trend is upwards. One of the largest breaks in this trend was the recession of 2007–2009, discussed in detail in Chapter 13. As the graph shows, growth of GDP per capita started to recover after 2010. GDP per capita has continued to grow, reaching over $54,000 in 2018.
Figure 0.1 GDP per Capita, 1960–2018 (Constant 2010 USD)
Source: World Bank, World Development Indicators database.
BOX 0.2 U.S. UNEMPLOYMENT RATE
What it is: The unemployment rate is a measure of the proportion of people in the labor force who are seeking jobs but unable to find them (discussed in Chapters 7 and 8). The measure does not include people who have part-time work but would like full-time work, nor does it include “discouraged workers” who have given up looking for work. The unemployment rate typically falls during economic expansions and rises during and immediately after economic recessions.
The results: U.S. unemployment has varied since 1960 between about 3 and 10 percent. In expansionary periods such as the late 1960s and the late 1990s, it was between 3.5 and 5 percent. In recessions, it has typically risen above 6 percent, with peaks of nearly 10 percent in 1982 and 2009, resulting from severe recessions. Since 2016, the unemployment rate has remained below 5 percent, and in 2018 it reached a nearly five-decade low of 3.9 percent, suggesting strong labor market conditions.
Figure 0.2 Unemployment Rate (Annual Average), 1960–2018
Source: U.S. Bureau of Labor Statistics, Current Population Survey, 2019.
BOX 0.3 U.S. INFLATION RATE
What it is: The inflation rate is a measure of the average increase in prices between one year and the next. It is measured by the change in the consumer price index (CPI), discussed in Chapter 8. There are various versions of the CPI; the graph presented here is based on the CPI-U, which measures the cost of living in urban areas.
The results: The U.S. inflation rate has varied considerably since 1960, with noticeable peaks in the late 1970s and early 1980s. At these times, the inflation rate rose above 10 percent (referred to as “double-digit inflation”). This level of inflation is considered significantly harmful to an economy, as discussed in Chapter 9. Since 1992, inflation rates in the United States have generally been fairly low, not rising above 4 percent, and averaging around 2 percent. During the 2007–2009 recession, inflation briefly fell to zero, arousing concern about deflation—negative inflation or generally falling prices. (Although some might think that falling prices would be a good thing, sustained deflation can be very damaging to businesses and reduce employment, as occurred during the Great Depression of the 1930s.)
Figure 0.3 Inflation Rate, 1960–2018
Source: U.S. Bureau of Labor Statistics, Consumer Price Index (CPI-U), 2019.
BOX 0.4 INCOME INEQUALITY
What it is: The graph presented here shows the trend in income inequality in the United States between 1925 and 2014. Percentage share of income going to the richest 10 percent of the population is used as an indicator of inequality. A decline in the value of this indicator implies lower inequality, with a greater share of income going to the bottom 90 percent of the population.
The results: Income inequality in the United States has varied considerably over time. It declined sharply in the early 1940s, with the economic prosperity during and after World War II, along with the implementation of New Deal policies. While inequality remained relatively stable until the 1960s, it has been increasing since then, reaching almost as high as the peak inequality levels right before the Great Depression. This trend in inequality can be explained by the changes in tax and labor market policies, among other things, as will be discussed in detail in Chapter 13.
Figure 0.4 Percentage Share of Income Earned by the Richest 10 Percent of Population, 1925–2014 ...

Table of contents