Think about your data intelligently and ask the right questions
Key Features
Master data cleaning techniques necessary to perform real-world data science and machine learning tasks
Spot common problems with dirty data and develop flexible solutions from first principles
Test and refine your newly acquired skills through detailed exercises at the end of each chapter
Book Description
Data cleaning is the all-important first step to successful data science, data analysis, and machine learning. If you work with any kind of data, this book is your go-to resource, arming you with the insights and heuristics experienced data scientists had to learn the hard way.
In a light-hearted and engaging exploration of different tools, techniques, and datasets real and fictitious, Python veteran David Mertz teaches you the ins and outs of data preparation and the essential questions you should be asking of every piece of data you work with.
Using a mixture of Python, R, and common command-line tools, Cleaning Data for Effective Data Science follows the data cleaning pipeline from start to end, focusing on helping you understand the principles underlying each step of the process. You'll look at data ingestion of a vast range of tabular, hierarchical, and other data formats, impute missing values, detect unreliable data and statistical anomalies, and generate synthetic features. The long-form exercises at the end of each chapter let you get hands-on with the skills you've acquired along the way, also providing a valuable resource for academic courses.
What you will learn
Ingest and work with common data formats like JSON, CSV, SQL and NoSQL databases, PDF, and binary serialized data structures
Understand how and why we use tools such as pandas, SciPy, scikit-learn, Tidyverse, and Bash
Apply useful rules and heuristics for assessing data quality and detecting bias, like Benford's law and the 68-95-99.7 rule
Identify and handle unreliable data and outliers, examining z-score and other statistical properties
Impute sensible values into missing data and use sampling to fix imbalances
Use dimensionality reduction, quantization, one-hot encoding, and other feature engineering techniques to draw out patterns in your data
Work carefully with time series data, performing de-trending and interpolation
Who this book is for
This book is designed to benefit software developers, data scientists, aspiring data scientists, teachers, and students who work with data. If you want to improve your rigor in data hygiene or are looking for a refresher, this book is for you.
Basic familiarity with statistics, general concepts in machine learning, knowledge of a programming language (Python or R), and some exposure to data science are helpful.
Trusted by 375,005 students
Access to over 1.5 million titles for a fair monthly price.
Tidy datasets are all alike, but every messy dataset is messy in its own way.
–Hadley Wickham (cf. Leo Tolstoy)
A great deal of data both does and should live in tabular formats; to put it flatly, this means formats that have rows and columns. In a theoretical sense, it is possible to represent every collection of structured data in terms of multiple “flat” or “tabular” collections if we also have a concept of relations. Relational database management systems (RDBMSs) have had a great deal of success since 1970, and a very large part of all the world’s data lives in RDBMSs. Another large share lives in formats that are not relational as such, but that are nonetheless tabular, wherein relationships may be imputed in an ad hoc, but uncumbersome, way.
As the Preface mentioned, the data ingestion chapters will concern themselves chiefly with structural or mechanical problems that make data dirty. Later in the book we will focus more on content or numerical issues in data.
This chapter discusses tabular formats including CSV, spreadsheets, SQL databases, and scientific array storage formats. The last sections look at some general concepts around data frames, which will typically be how data scientists manipulate tabular data. Much of this chapter is concerned with the actual mechanics of ingesting and working with a variety of data formats, using several different tools and programming languages. The Preface discusses why I wish to remain language-agnostic—or multilingual—in my choices. Where each format is prone to particular kinds of data integrity problems, special attention is drawn to that. Actually remediating those characteristic problems is largely left until later chapters; detecting them is the focus of our attention here.
As The Hitchhiker’s Guide to the Galaxy is humorously inscribed: “Don’t Panic!”. We will explain in much more detail the concepts mentioned here.
***
We run the setup code that will be standard throughout this book. As the Preface mentions, each chapter can be run in full, assuming available configuration files have been utilized. Although it is not usually best practice in Python to use import *, we do so here to bring in many names without a long block of imports:
from src.setup import * %load_ext rpy2.ipython %%R library(tidyverse)
With our various Python and R libraries now available, let us utilize them to start cleaning data.
Tidying Up
After every war someone has to tidy up.
–Maria Wisława Anna Szymborska
Concepts:
Tidiness and database normalization
Rows versus columns
Labels versus values
Hadley Wickham and Garrett Grolemund, in their excellent and freely available book R for Data Science, promote the concept of “tidy data.” The Tidyverse collection of R packages attempt to realize this concept in concrete libraries. Wickham and Grolemund’s idea of tidy data has a very close intellectual forebear in the concept of database normalization, which is a large topic addressed in depth neither by them nor in this current book. The canonical reference on database normalization is C. J. Date’s An Introduction to Database Systems (Addison Wesley; 1975 and numerous subsequent editions).
In brief, tidy data carefully separates variables (the columns of a table, also called features or fields) from observations (the rows of a table, also called samples). At the intersection of these two, we find values, one data item (datum) in each cell. Unfortunately, the data we encounter is often not arranged in this useful way, and it requires normalization. In particular, what are really values are often represented either as columns or as rows instead. To demonstrate what this means, let us consider an example.
Returning to the small elementary school class we presented in the Preface, we might encounter data looking like this:
students = pd.read_csv('data/students-scores.csv') students
Last Name First Name 4th Grade 5th Grade 6th Grade 0 Johnson Mia A B+ A- 1 Lopez Liam B B A+ 2 Lee Isabella C C- B- 3 Fisher Mason B B- C+ 4 Gupta Olivia B A+ A 5 Robinson Sophia A+ B- A
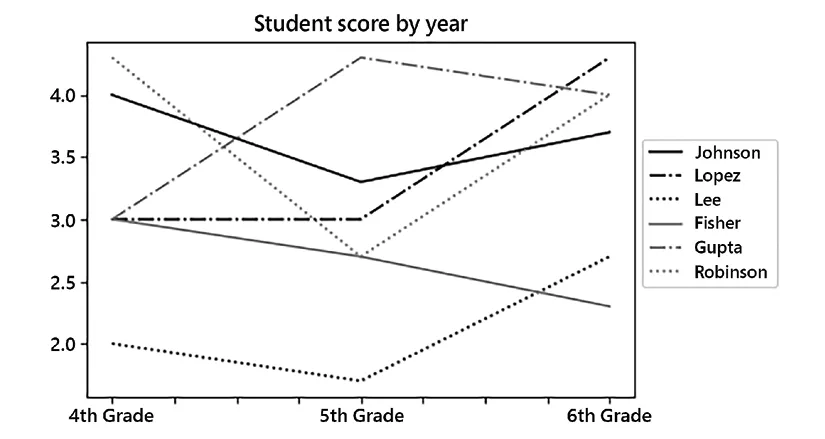
This view of the data is easy for humans to read. We can see trends in the scores each student received over several years of education. Moreover, this format might lend itself to useful visualizations fairly easily:
This next cell uses a “fluent” programming style that may look unfamiliar to some Python programmers. I discuss this style in the section below on data frames. The fluent style is used in many data science tools and languages.
For example, this is typical Pandas code that plots the students’ scores by year:
(students .set_index('Last Name') .drop('First Name', axis=1) .apply(num_score) .T .plot(title="Student score by year") .legend(bbox_to_anchor=(1, .75)) );
Figure 1.1: Student scores by year
This data layout exposes its limitations once the class advances to 7th grade, or if we were to obtain 3rd grade information. To accommodate such additional data, we would need to change the number and position of columns, not simply add additional rows. It is natural to make new observations or identify new samples (rows) but usually awkward to change the underlying variables (columns).
The particular class level (e.g. 4th grade) that a letter grade pertains to is, at heart, a value, not a variable. Another way to think of this is in terms of independent variables versus dependent variables, or in machine learning terms, features versus target. In some ways, the class level might correlate with or influence the resulting letter grade; perhaps the teachers at the different levels have different biases, or children of a certain age lose or gain interest in schoolwork, for example.
For most analytic purposes, this data would be more useful if we made it tidy (normalized) before further processing. In Pandas, the DataFrame.melt() method can perform this tidying. We pin some of the columns as id_vars, and we set a name for the combined columns as a variable and the letter grade as a single new column. This Pandas method is slightly magical and takes some practice to get used to. The key thing is that it preserves data, simply moving it between column labels and data values:
First Name Last Name Level Score Mia Johnson 4th Grade A Liam Lopez 4th Grade B Isabella Lee 4th Grade C Mason Fisher 4th Grade B ... ... ... ... Isabella Lee 6th Grade B- Mason Fisher 6th Grade C+ Olivia Gupta 6th Grade A Sophia Robinson 6th Grade A 18 rows × 1 columns
In the R Tidyverse, the procedure is similar. A tibble, which we see here, is simply a kind of data frame that is preferred in the Tidyverse:
Yes, you can cancel anytime from the Subscription tab in your account settings on the Perlego website. Your subscription will stay active until the end of your current billing period. Learn how to cancel your subscription
No, books cannot be downloaded as external files, such as PDFs, for use outside of Perlego. However, you can download books within the Perlego app for offline reading on mobile or tablet. Learn how to download books offline
We are an online textbook subscription service, where you can get access to an entire online library for less than the price of a single book per month. With over 1.5 million books across 990+ topics, we’ve got you covered! Learn about our mission
Look out for the read-aloud symbol on your next book to see if you can listen to it. The read-aloud tool reads text aloud for you, highlighting the text as it is being read. You can pause it, speed it up and slow it down. Learn more about Read Aloud
Yes! You can use the Perlego app on both iOS and Android devices to read anytime, anywhere — even offline. Perfect for commutes or when you’re on the go. Please note we cannot support devices running on iOS 13 and Android 7 or earlier. Learn more about using the app
Yes, you can access Cleaning Data for Effective Data Science by David Mertz in PDF and/or ePUB format, as well as other popular books in Informatica & Informatica generale. We have over 1.5 million books available in our catalogue for you to explore.