A thought-provoking look at the unsettled science of global warming—from a former volcanologist, geophysicist, and US Geological Survey scientist.
Thousands of scientists are convinced beyond any reasonable doubt that recent global warming is being caused by emissions of greenhouse gases and that we must act immediately to reduce these emissions or else we may render Earth unlivable for our children and grandchildren. Some even say "the science is settled."
What Really Causes Global Warming? examines a broad range of observations that show that greenhouse warming theory is not only misguided, but not physically possible. Recent warming was caused by ozone depletion due to emissions of human-manufactured gases. We solved that problem with the Montreal Protocol on Substances that Deplete the Ozone Layer stopping the increase in global temperatures by 1998. Volcanoes also deplete ozone. The eruption of Bárðarbunga volcano in central Iceland from August 2014 to February 2015?the largest effusive, basaltic, volcanic eruption since 1783?caused 2015 to be the hottest year on record. How can we adapt?
eBook - ePub
What Really Causes Global Warming?
Greenhouse Gases or Ozone Depletion?
- 237 pages
- English
- ePUB (mobile friendly)
- Available on iOS & Android
eBook - ePub
About this book
Trusted by 375,005 students
Access to over 1.5 million titles for a fair monthly price.
Study more efficiently using our study tools.
Information
CHAPTER 1
HOW I CAME TO WONDER ABOUT CLIMATE CHANGE
“In the fields of observation, chance favors only the prepared mind.”
What should I do if this volcano starts to erupt? I’m 19 years old, climbing to the summit of an active volcano in Alaska with my Dartmouth College professor and life-long mentor, Bob Decker. He was already recognized as a world-class expert on active volcanoes, and he went on to be Scientist in Charge at the Hawaiian Volcano Observatory and President of the International Association of Volcanology and Chemistry of the Earth’s Interior.
We are walking up the side of Mt. Trident, a volcano named for its three prominent peaks, but we are on a new, fourth peak that has grown nearly 1000 feet (300 meters) vertically in the past ten years. We’ve studied this volcano from distant hill-tops, from circling around it in a very small airplane, and from pictures of recent eruptions in the files of the National Park Service. Now we are on the ground, exploring the details up close and personal, walking where very few people have been before.
Katmai National Monument, 250 miles southwest of Anchorage, Alaska, is the size of the state of Connecticut, but it is remote country, with only one 23-mile-long dirt road, accessed by float plane. This one-lane, primitive road, still under construction in 1963, heads southeast from Brooks Camp, taking tourists to an overlook from which they can see the Valley of 10,000 Smokes and many volcanoes. We wave goodbye, to the bus driver, shoulder our packs, and hike south for two days through the Valley of 10,000 Smokes and through Katmai Pass for our first glimpse of Trident volcano (Figure 1.1).
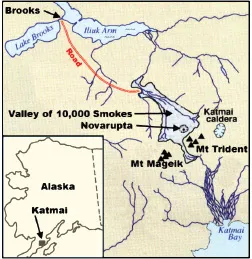
Figure 1.1 In 1912, Mt. Katmai erupted, disgorging a huge pyroclastic flow from Novarupta, forming the Valley of 10,000 Smokes. Mt. Trident was just to the south. The red line shows the road from Brooks Camp to the Overlook.
The Valley of 10,000 Smokes was named by Robert Griggs, leader of a National Geographic Society expedition in 1916, whose objective was to explore the source of the 1912 eruption of Mt. Katmai, the largest volcanic eruption of the 20th century. Griggs had landed by ship in Katmai Bay, and had then hiked northward along the Katmai River Delta, up past Mt. Trident to Katmai Pass. “The sight that flashed into view as we surmounted the hillock was one of the most amazing visions ever beheld by mortal eye,” he wrote. “The whole valley as far as the eye could reach was full of hundreds, no thousands—literally, tens of thousands—of smokes curling up from its fissured floor.”10 A frothy cloud of volcanic gases and rock fragments, variously referred to as a pyroclastic flow, a glowing avalanche, or a nuée ardente, had flowed out of the Novarupta vent, filling the valley within minutes with deposits that, when cooled, would become a dense, flinty rock called welded tuff capped with a light, frothy rock called pumice. In 1965, I measured a thickness of the valley fill in one prominent location as 98 feet (30 m), after substantial erosion, but some think that the pyroclastic flow could have been as much as 689 feet (210 m) thick in places.11 A similar flow in 1902, just ten years before the Katmai eruption, had buried the town of St. Pierre in the Lesser Antilles arc of the Caribbean, killing 30,000 people instantly. In 1963, the Valley of 10,000 Smokes had just a few steaming vents left, and they were barely hot enough to form steam.
In 1953, Trident volcano began forming a new volcanic cone on its southwest flank. The cone had grown 853 feet (260 m) by 1960. Some ash eruptions had reached altitudes of more than 5.6 mi (9 km). Viscous, blocky black lava flowed out of the volcano’s vent throughout the 1950s forming flows as thick as 984 feet (300 m), covering 2 mi2 (5 km2) and forming 100-foot high cliffs, far too steep and unstable to climb (Figure 1.2).
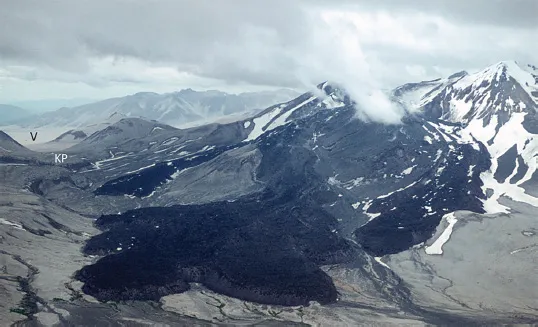
Figure 1.2 Mt. Trident, Alaska, August 1963, looking to the northwest and showing the black 100-foot-thick lava flows erupted in the 1950s. The Valley of 10,000 Smokes (V) is seen one third of the way down the left edge. Katmai Pass (KP) is just to the south.
As we hike up along the western edge, I am thinking about the awesome power of Nature and about where we should run if the ground starts shaking. What’s the quickest way out of here? We think the odds of an eruption today are very low, but they are not zero. I reflect on the lengths to which scientists are willing to go in order to collect quality data. Are we crazy? The volcano actually did explode just three years later.
A large cloud of volcanic gases is blowing southward from the summit, dimming sunlight. As we climb around to the north side of the new peak, we find the wind is blowing so hard that the gases are pushed close to the ground, leaving us clean air to breathe as long as we remain standing (Figure 1.3).
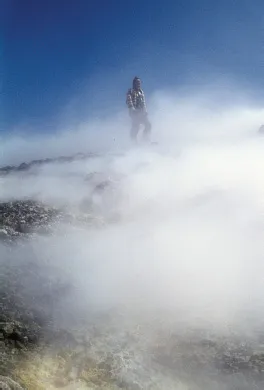
Figure 1.3 Robert Decker near the north side of the summit of Mt. Trident looking at the smoking fumaroles.
As we climb higher and higher up the new peak, the pungent odor of sulfur dioxide is getting stronger. Too much sulfur dioxide mixed with water in your nose or lungs makes sulfuric acid. Not a healthy combination.
As we climb to the peak, we see more and more fresh sulfur deposited around gas vents—fumaroles—which are getting very close together. Thousands of these are the source of the gas cloud we had seen from below. We try to measure the gas temperature where it comes out of the ground (Figure 1.4), but it drives our thermometer off scale. The ground is too hot to sit on. Even my feet, safely inside my thick-soled Peter Limmer climbing boots, are feeling hot. The power of volcanoes up close truly is impressive. I find myself wondering whether scientists can ever understand volcanoes well enough to predict their eruptions, to save lives, and to minimize economic damage.
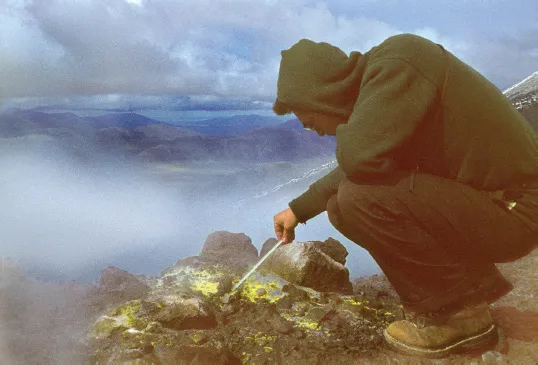
Figure 1.4 Decker measuring the temperature of a fumarole on Mt. Trident. In the background, center-left, you can see the infamous Valley of 10,000 Smokes, formed during the massive eruption of Mt. Katmai/Novarupta in 1912, the largest volcanic eruption in the 20th century.
Living More Safely With Earthquakes
That was August 1963. In March 1964, the world’s second most powerful earthquake ever recorded, with a magnitude of 9.2, ruptured the ground for more than 500 miles (800 km) along a fault stretching to the northeast from well south of Mt. Trident, past Kodiak Island, and all the way to Valdez, Alaska, which is 40 miles east of Anchorage (Figure 1.6).
The ground shook violently for four minutes. I know from personal experience that ground shaking for 20 seconds during an earthquake seems like an eternity. Four minutes! A lot can happen in that amount of time. Water waves—a tsunami—as high as 330 feet inundated the coast of Alaska. The ground moved permanently as much as 38 feet in some locations. Landslides and destroyed buildings were widespread, but thankfully population density was low. Only 139 people were killed, most due to the water waves. In 1976, a hundred times smaller earthquake of magnitude 7.5 in densely populated Tangshan, China, is reported to have killed 655,000 people in 16 seconds of severe ground shaking.
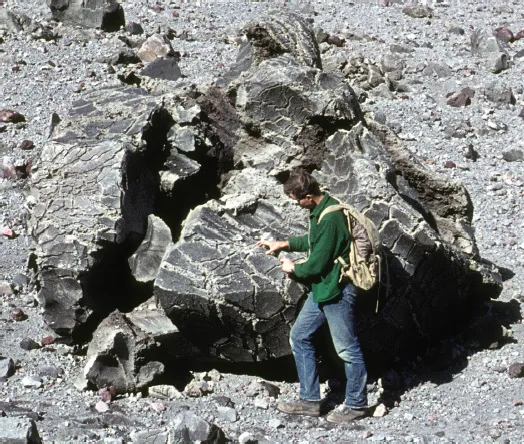
Figure 1.5 The author examining a bread crust bomb erupted from Mt. Trident. As this 7-foot high block of lava was ejected into the air, the outside chilled, forming a crust while the inside continued to expand.
When I arrived back in Anchorage in June, I could see where five blocks of stores along the north side of Fourth Avenue had sunk 12 feet (Figure 1.7).
While I was eating dinner on the top floor of the Anchorage Westward Hotel, the waiter, with eyes as big as saucers, explained to me how everything in that large room slid from wall to wall as the building swayed back and forth for four minutes. The awesome power of the Great Alaskan Earthquake of 1964 made Mt. Trident seem pretty insignificant. By studying earthquakes, I wondered, could we predict them? Could scientists help us build communities that would be less vulnerable to Nature’s wrath?
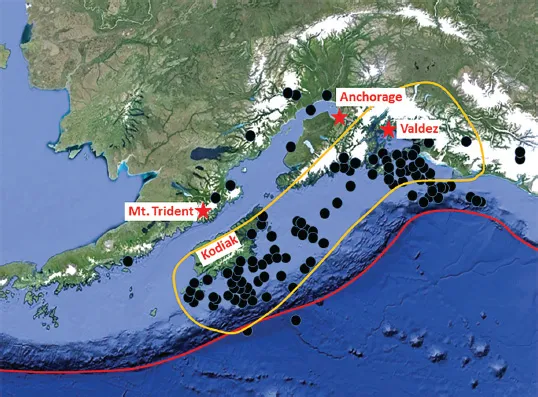
Figure 1.6 The Great Alaskan Earthquake of 1964 broke the ground at depth from Valdez to southwest of Kodiak Island. Red line is the Aleutian trench. Yellow line shows the area of major uplift. Circles show the locations of major aftershocks, dominantly at depths of 12 to 22 mi (20 to 35 km).
In June, 1965, I returned to Anchorage on my honeymoon. My wife and I had come to study earthquakes in the vicinity of Mt. Trident and their relationship to volcanism, but now I was a graduate student. I had decided to dedicate my life to studying earthquakes and volcanoes and to learning how we humans could live more safely with these extremes of Nature.
Katmai National Monument had been established in 1918 to preserve the area for the study of volcanism as a result of the Griggs expedition and several articles published in National Geographic. I was fortunate to spend three summers there in the 1960s and five more in the 1980s, studying earthquakes associated with volcanism in what became, in 1980, Katmai National Park, known to most people for the many pictures taken of bears gobbling salmon swimming up Brooks Falls to spawn in Brooks Lake (Figure 1.8).
The Great Alaskan Earthquake of 1964 was a wake-up call for America. After ten years of study, volumes of reports, a devastating magnitude 6.7 earthquake in San Fernando Valley north of Los Angeles in 1971, strong interest from Senator Alan Cranston (California), and years of scientific leadership by MIT professor Frank Press, who became Jimmy Carter’s Science Advisor, earthquake hazard reduction was becoming a national priority.
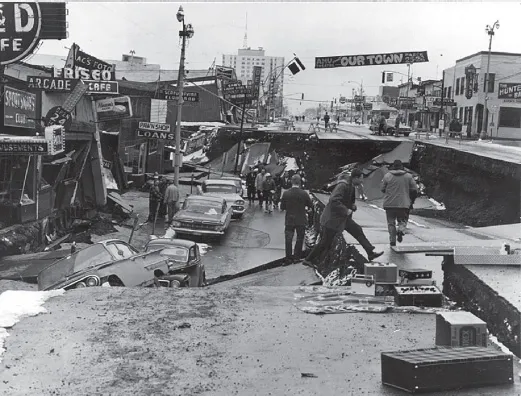
Figure 1.7 Five blocks along the north side of Fourth Avenue in Anchorage, Alaska, settled more than 12 feet during the Great Alaskan Earthquake of 1964.
On January 1, 1975, I was appointed Chief of the Branch of Seismology, a group of 140 scientists and staff at the United States Geological Survey in Menlo Park, California, right next to Stanford University. In the 1970s, scientists from around the world were discovering physical changes that were occurring days to months before major earthquakes. On February 4, 1975, local political leaders in Haicheng, Liaoning, China, ordered evacuation of dangerous buildings hours before a magnitude 7.3 earthquake severely damaged this city of one million people, saving countless lives. One tipoff to this earthquake was that snakes began to come out of hibernation during the winter, possibly because of warming of the ground due to rising water levels due to increasing pre-earthquake strain of the ground. Earthquake prediction is a high priority in China, where a majority of people live in poorly-constructed buildings that are likely to be destroyed during major local earthquakes.
There were many other tantalizing observations of possible earthquake precursors from around the world, but none was measured sufficiently well to allow us to understand the physics involved. In early December, 1975, my colleague Bob Castle handed me a preliminary plot of ground deformation12 northeast of Los Angeles to present at our earthquake advisory panel meeting the next day. Could this deformation be a precursor to the next big southern California earthquake on a fault that had not slipped since 1857? The panel, chaired by Frank Press, agreed that it was entirely possible.
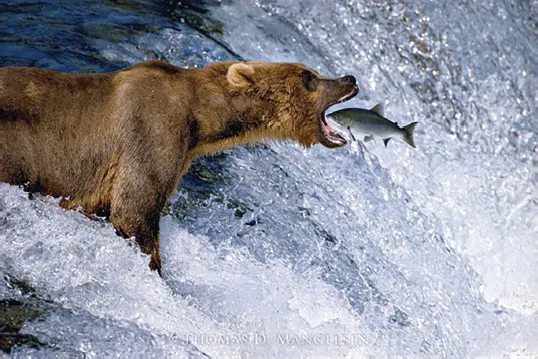
Figure 1.8 Catch of the Day, a famous photo by Thomas D. Mangelsen, at Brooks Falls in Katmai National Park, Alaska.
Consequently, in 1976, I was invited to brief the Presidential Advisory Group on Anticipated Advances in Science and Technology. Right after my presentation, Edward Teller, of hydrogen bomb fame, turned to Vice President Rockefeller and exclaimed that the possibility of predicting earthquakes was a very promising new advance in science and technology. The ponderous wheels of Washington began to turn a little faster, at least in regard to earthquakes. The Earthquake Hazards Reduction Act of 1977 (Public Law 95-124) established the National Earthquake Hazard Reduction Program. The Branch of Seismology, which I headed, became the Branch of Earthquake Mechanics and Prediction. Excitement was high. We were convinced that earthquakes just might be predictable if we could only trap several of them within dense networks of instruments so that we could map out the physical extent and accurate timing of these apparent precursors. We had already gotten pretty good at mapping out specific regions where earthquakes were most likely to occur—regions known as seismic gaps, where no earthquakes had occurred for decades to centuries. Now, careful scientific observations and research might provide a way to save many lives.
Very soon, however, we began to realize that the physics of earthquake prediction might be easier than the sociology. In the midst of a research program in which you are trying to figure out reliable ways to predict earthquakes, how do you warn people that a major earthquake might occur tomorrow that could kill them, but you are only 5% certain? What action is appropriate if a devastating event is possible within a certain time interval but not highly likely? This made me reflect on our decision that it was okay to explore an active volcano up close, when we thought the likelihood of an eruption was low. Many volcanologists have done that. A few, however, did not return.
If we had credible information that an earthquake might occur, we realized that we had no choice but to communicate what we knew to the people at risk as clearly as we could, but how should we craft our message to make the information most useful? How could we help people prepare to make critical decisions rapidly if a prediction was issued?
We put instruments along many faults where earthquakes were highly likely, hoping to record at least one within a dense network of stations, but to our frustration, no earthquakes came out to play. They were apparently not on the same schedule as federal legislation.
We also found that good scientists, when faced with very sketchy data sugge...
Table of contents
- Cover
- Title
- Copyright
- Table of Contents
- List of Figures
- Foreword A More Persuasive Truth
- Preface
- Overview Climate Is Never “Settled,” and Neither Is Science
- Chapter 1 How I Came to Wonder About Climate Change
- Chapter 2 Could Climate Change Science Be Mistaken?
- Chapter 3 Why Did Global Temperatures Stop Increasing in 1998?
- Chapter 4 Do We Really Understand Thermal Energy?
- Chapter 5 How Does the Atmosphere Protect Earth From Sun’s “Hottest” Radiation?
- Chapter 6 How Do Minute Amounts of Ozone Control Climate?
- Chapter 7 How Does Temperature Change With Ozone Depletion?
- Chapter 8 How Can Volcanoes Both Cool and Warm Earth?
- Chapter 9 How Do Volcanic Eruptions Affect Weather?
- Chapter 10 Why Does the Greenhouse Effect Appear Not to be Correct?
- Chapter 11 What Are Some Other Implications of Light Being a Continuum of Frequency?
- Chapter 12 How Could Science Have Been So Far Off the Mark?
- Chapter 13 Where Do We Go From Here?
- Glossary
- About the Author
- End Notes
- Index
Frequently asked questions
Yes, you can cancel anytime from the Subscription tab in your account settings on the Perlego website. Your subscription will stay active until the end of your current billing period. Learn how to cancel your subscription
No, books cannot be downloaded as external files, such as PDFs, for use outside of Perlego. However, you can download books within the Perlego app for offline reading on mobile or tablet. Learn how to download books offline
Perlego offers two plans: Essential and Complete
- Essential is ideal for learners and professionals who enjoy exploring a wide range of subjects. Access the Essential Library with 800,000+ trusted titles and best-sellers across business, personal growth, and the humanities. Includes unlimited reading time and Standard Read Aloud voice.
- Complete: Perfect for advanced learners and researchers needing full, unrestricted access. Unlock 1.5M+ books across hundreds of subjects, including academic and specialized titles. The Complete Plan also includes advanced features like Premium Read Aloud and Research Assistant.
We are an online textbook subscription service, where you can get access to an entire online library for less than the price of a single book per month. With over 1.5 million books across 990+ topics, we’ve got you covered! Learn about our mission
Look out for the read-aloud symbol on your next book to see if you can listen to it. The read-aloud tool reads text aloud for you, highlighting the text as it is being read. You can pause it, speed it up and slow it down. Learn more about Read Aloud
Yes! You can use the Perlego app on both iOS and Android devices to read anytime, anywhere — even offline. Perfect for commutes or when you’re on the go.
Please note we cannot support devices running on iOS 13 and Android 7 or earlier. Learn more about using the app
Please note we cannot support devices running on iOS 13 and Android 7 or earlier. Learn more about using the app
Yes, you can access What Really Causes Global Warming? by Peter Langdon Ward in PDF and/or ePUB format, as well as other popular books in Biological Sciences & Global Warming & Climate Change. We have over 1.5 million books available in our catalogue for you to explore.