In the era of Evidence Based Medicine, health professionals are required to fully understand design, analysis and interpretation of the results of research. Furthermore, they should be able to assess the needs of their communities and respond accordingly. To achieve these goals, clinicians need to be familiar with the basic concepts of epidemiology and biostatistics. But epidemiology is more than "the study of." Its application and practice are essential to address public health issues. That is why this book provides not only the theory, but also the opportunity of applying it in practice. In fact, each chapter presents one or more specific examples on how to perform an epidemiological or statistical data analysis and includes download access to the software and databases, giving the reader the possibility of replicating the analyses described. The final purpose is, therefore, to introduce epidemiologic and biostatistical methods as applied to clinical research, and to develop proficiency with computer software for performing the analysis of clinical datasets.

- English
- ePUB (mobile friendly)
- Available on iOS & Android
eBook - ePub
About this book
Trusted by 375,005 students
Access to over 1.5 million titles for a fair monthly price.
Study more efficiently using our study tools.
Information
Topic
MedicineSubtopic
Biostatistics1. Measures of Occurrence
Carlo Signorelli1, Edoardo Colzani2
1 University of Parma, Italy
2 University of Milano-Bicocca, Italy
Objectives of the chapter
- To describe the measures of occurrence.
- To give some practical examples showing how to get them from a dataset using the statistical package SPSS.
1.1. Introduction
One of the objectives of epidemiology is to describe the frequency and distribution of diseases and other health-related events and to assess the association between possible risk factors and diseases. An initial contrast must be made between measures of occurrence (the ones describing a health phenomenon) and measures of association (the ones describing the strength of a possible association between an exposure and a health outcome). In this chapter, we will spend some time on the measures of occurrence. Measures of association will be discussed in a later chapter (see chapter 2).
The measures of occurrence can be divided into the following groups [1]:
- Description of number of events.
- Ratios.
- Proportions.
- Rates.
The description of the number of events usually only satisfies an administrative need for quantifying a phenomenon, but doesn’t usually give any information about the denominator to which it is referring. Knowing, for instance, how many people are sick with a certain disease could help institutions organize their healthcare facilities accordingly, but it would not give any additional information on how that disease is spread in that particular group of people in the absence of a denominator or a time reference.
A ratio expresses the relationship between two independent quantities. For instance, if eight women and two men make up a group of 10, the women-to-men ratio would be: 8/2 = 4. A particular kind of ratio used often in epidemiology is an odds ratio that will be discussed more in a later chapter (see chapter 2).
The proportion is a kind of ratio in which the denominator always includes the numerator (therefore the two quantities are not independent). The values of this ratio are always included between 0 and 1 and they may also be expressed as a percentage (0% to 100%). In the example given above, the proportion of women is 8/10 = 0.8 or 80%. A proportion can easily express the fraction of a population affected by a certain disease.
A rate is a measure in which a time dimension is introduced into the formula. If we want to measure the new cases of a disease in a community, we would need to specify the time in the formula such as when we want to calculate the speed of a vehicle. For instance, if there were five new cases of a disease in a group of 10 people in three days, there would be a rate of 5/(10 x 3) = 0.17 cases per person-day in the population. A rate can theoretically go from 0 up to infinity since we can also use a time reference with values less than a unit (say 0.1 days, etc.). To sum up, a rate is a dynamic measure that could, for example, describe how fast a disease is spreading in a population or how fast a health-related phenomenon is occurring [2].
1.2. Prevalence
A specific kind of proportion largely used in epidemiology is the prevalence. The prevalence can be defined as the proportion of cases of disease (or of another health-related phenomenon) at a certain time or period in the overall population.
Some refer to point prevalence when it is measured in a specific moment, and to period prevalence when it is measured over a defined period of time (a month, a year, etc.) [3]. The point prevalence can have big variations, especially if it measures diseases with a short duration, like infectious diseases that can wax and wane over relatively short periods of time. For instance, we could have a certain prevalence of influenza on one day and a very different one on the following day.
The period prevalence partially solves this problem since it is focused on a broader period of time and represents a good average of the phenomenon. In the denominator, it is usually considered the population at the mid-point of the time period. So, if we consider the prevalence of a certain disease over a year, the denominator will be the overall population on June 30 (had it been over a month, there would be the overall population on the 15th day of that same month, etc.), and the numerator will be the number of people with the disease in that year (both new and existing cases). The period prevalence always considers the entire population and this differentiates it from the incidence rate.
The prevalence has to be considered a static measure since it does not take time into account and also considers the existing cases of disease, not just the new cases. It is like a cross-sectional picture of a certain health-related phenomenon and it is mainly used to describe the fraction of a certain population affected by a disease or a risk factor. Its use is more frequently related to healthcare planning and the cost analysis of certain interventions [4].
1.3. Incidence
The incidence is an epidemiologic measure that indicates the risk of developing a disease over a period of time; in other words, how many new cases of disease have occurred during a specific period of time in an at-risk population. It is a more dynamic measure compared to the prevalence, and can be calculated as a proportion (cumulative incidence, incidence proportion, or incidence risk) or, more frequently, as a rate (incidence rate, incidence density, or person-time incidence) [5].
The incidence proportion (or cumulative incidence or incidence risk) considers the number of new cases of disease in the numerator. The denominator is the population at risk for that disease at the beginning of the period of observation [6], so any individual counted in the denominator has, in theory, some chance of being counted in the numerator as well. Therefore, the denominator does not include people who already have the disease or people who surely cannot develop the disease—for instance, individuals fully immunised against a certain communicable disease.
The time reference of the incidence always has to be specified: if we had four new cases of measles in the last week in a group of 10 subjects, one of which had been immunised and another had already had the disease, we would say that the incidence proportion of influenza is four new cases divided by 8 (10 – 2) subjects at risk, per week, which is equal to 0.5 or 50%. The proportion of 50% could be also called the risk that a member of that group of people will develop influenza in a week: that is why it is also called incidence risk.
The incidence rate (or incidence density or person-time incidence) shares the exact same numerator (number of new cases) as the incidence proportion, but since it is a rate, it also includes time in the denominator so that person-times at risk as well as persons at risk are factored into the formula and it can be more accurate. It is particularly helpful when the event happens to the same person more than once during the study period and the investigators want to take this into account [7].
Using the example above, let us assume that we want to know the incidence rate of influenza per day and not per week. Because there are seven days in a week, the incidence rate would be: 4/(10 – 2) x 7 = 0.07 new cases of influenza per person-day (and not just “per person”) at risk.
The advantage of considering the incidence rate instead of the incidence proportion is the higher accuracy of the former. In fact, if the group above were a dynamic cohort with people coming in and out over the period of time considered (one week), we could have easily taken into account each person’s respective contribution to the denominator by only considering the actual at-risk periods each person spent in the cohort without giving the same weight to people staying in the cohort at risk for just one day and to people who were at risk for the entire period.
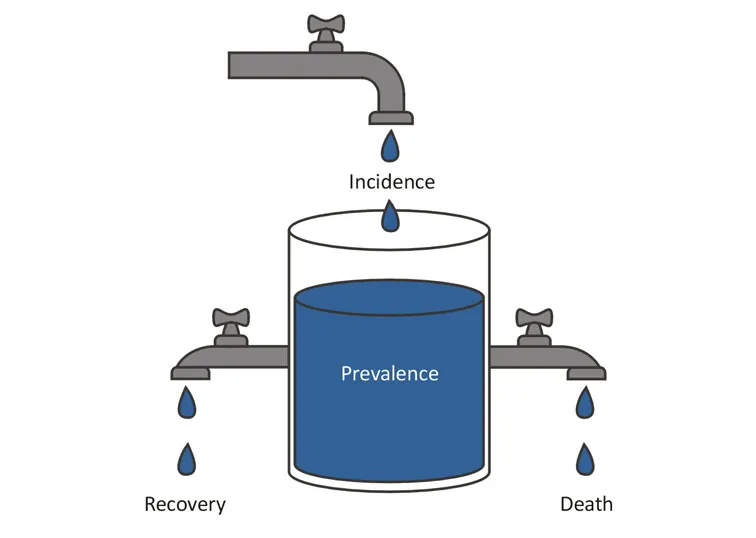
Figure 1.1: Relationship between incidence and prevalence.
The incidence is a more dynamic measure because it takes time into account. The incidence proportion gives more of an estimate of the individual risk of getting a certain disease by not taking into account all the at-risk periods of time, and only using at-risk individuals in the denominator. The incidence rate instead can be seen as an estimate of the speed of a certain health-related phenomenon by taking time into account in the computational formula.
In a steady-state situation, in which the inflow of subjects in the population equals the outflow, and with a steady incidence over time, the following relationship applies:

Therefore, prevalence is affected both by changes in incidence and disease duration. In fact, if we notice an increase in prevalence of a certain disease, we can expect it to be due either to an increase in incidence (more new cases) or to an increase in disease duration (increased survival), or both (Figure 1.1).
For instance, if we knew that the incidence of pancreatic cancer was 10/100,000 per year, and that its prevalence was 25/100,000 in a certain year, then we could estimate the average duration of the disease by dividing the prevalence by the incidence [1]:

1.4. Practical issues
1.4.1. Denominator issues
When investigators are dealing with large populations, the issue of the incidence denominator, which should just include the people (or ...
Table of contents
- Colophon
- Preface
- 1. Measures of Occurrence
- 2. Measures of Association
- 3. Controlling for Confounding
- 4. Cross-Sectional Studies
- 5. Cohort Studies
- 6. Experimental Studies
- 7. Temporal Trend Analysis
- 8. The Surveillance of Sexually Transmitted Infections: the Theory and the Practice
- 9. Systematic Reviews and Meta-Analysis of Clinical Trials
- 10. Meta-Analysis of Observational Studies
- 11. Genetic Epidemiology
- 12. Analysis of Cost Data Using Bootstrap Technique
- 13. Sensitivity, Specificity, and ROC Curves
- 14. Measures of Central Tendency and Dispersion
- 15. Sample Size Calculations
- 16. Representation of Data
- 17. Running Multiple Regression With Quantitative and Qualitative Variables With R
- 18. Methods for Assessing Normality of Quantitative Variables
- 19. Quality of Life Evaluation
- 20. Disability Adjusted Life Years (DALY) Summary Measure of Population Health
Frequently asked questions
Yes, you can cancel anytime from the Subscription tab in your account settings on the Perlego website. Your subscription will stay active until the end of your current billing period. Learn how to cancel your subscription
No, books cannot be downloaded as external files, such as PDFs, for use outside of Perlego. However, you can download books within the Perlego app for offline reading on mobile or tablet. Learn how to download books offline
Perlego offers two plans: Essential and Complete
- Essential is ideal for learners and professionals who enjoy exploring a wide range of subjects. Access the Essential Library with 800,000+ trusted titles and best-sellers across business, personal growth, and the humanities. Includes unlimited reading time and Standard Read Aloud voice.
- Complete: Perfect for advanced learners and researchers needing full, unrestricted access. Unlock 1.5M+ books across hundreds of subjects, including academic and specialized titles. The Complete Plan also includes advanced features like Premium Read Aloud and Research Assistant.
We are an online textbook subscription service, where you can get access to an entire online library for less than the price of a single book per month. With over 1.5 million books across 990+ topics, we’ve got you covered! Learn about our mission
Look out for the read-aloud symbol on your next book to see if you can listen to it. The read-aloud tool reads text aloud for you, highlighting the text as it is being read. You can pause it, speed it up and slow it down. Learn more about Read Aloud
Yes! You can use the Perlego app on both iOS and Android devices to read anytime, anywhere — even offline. Perfect for commutes or when you’re on the go.
Please note we cannot support devices running on iOS 13 and Android 7 or earlier. Learn more about using the app
Please note we cannot support devices running on iOS 13 and Android 7 or earlier. Learn more about using the app
Yes, you can access Applied Epidemiology and Biostatistics by Giuseppe La Torre in PDF and/or ePUB format, as well as other popular books in Medicine & Biostatistics. We have over 1.5 million books available in our catalogue for you to explore.