Are you buying a car or smartphone or dishwasher? We bet long-term, trouble-free operation (i.e., high reliability) is among the top three things you look for. Reliability problems can lead to everything from minor inconveniences to human disasters. Ensuring high reliability in designing and building manufactured products is principally an engineering challenge–but statistics plays a key role.
Achieving Product Reliability explains in a non-technical manner how statistics is used in modern product reliability assurance.
Features:
Describes applications of statistics in reliability assurance in design, development, validation, manufacturing, and field tracking.
Uses real-life examples to illustrate key statistical concepts such as the Weibull and lognormal distributions, hazard rate, and censored data.
Demonstrates the use of graphical tools in such areas as accelerated testing, degradation data modeling, and repairable systems data analysis.
Presents opportunities for profitably applying statistics in the era of Big Data and Industrial Internet of Things (IIoT) utilizing, for example, the instantaneous transmission of large quantities of field data.
Whether you are an intellectually curious citizen, student, manager, budding reliability professional, or academician seeking practical applications, Achieving Product Reliability is a great starting point for a big-picture view of statistics in reliability assurance.
The authors are world-renowned experts on this topic with extensive experience as company-wide statistical resources for a global conglomerate, consultants to business and government, and researchers of statistical methods for reliability applications.
Trusted by 375,005 students
Access to over 1.5 million titles for a fair monthly price.
Reliability is a key concern for all products. In this chapter, we describe the critical role of statistics in reliability assurance and discuss the unique challenges associated with defining, measuring, and improving reliability. We set the stage for the remainder of the book by discussing the role of statistics in reliability assurance through the product cycle from early stages of design to manufacturing and field use.
1.1 Reliability: As the Customers See It
Are you buying a new car or smartphone or dishwasher? What are the top three things that you wish from your purchase? We bet your list includes long-term, trouble-free operation (i.e., high reliability). The buyer of a new car knows its price, takes it on a test drive, judges its appearance by looking at it, and evaluates its technical features by reviewing published specs. Assessing its reliability, however, is not that easy. You want to know, for example, whether—if the car is properly cared for—it will provide trouble-free service for the next, say, 12 years or if it is going to lead to mounting problems after just a few years. Its true reliability will be known to you only after you have used it for some (hopefully, a very long) period of time. Thus, new customers need to depend on such things as a seller company’s reputation, online reviews, and friends’ experiences to assess a product’s reliability. In addition, product warranty terms, while largely a tool for marketing, do provide indicators of the confidence that producers have in the reliability of their products.
We do not hear much about reliability when things go right—which, fortunately, is much of the time. It is, after all, not news that your plane landed safely. Unfortunately, the unexpected sometimes happens—especially in dealing with complex systems. Reliability problems can lead to everything from minor inconveniences (e.g., no toast for breakfast or a delay in getting to work) to potential human disasters (e.g., severe injury, or even death, due to a pacemaker or aircraft engine failure). We are all keenly aware of catastrophes that can result from poor reliability. Sidebar 1.1 briefly describes a small collection of well-publicized cases involving poor reliability of manufactured products or systems.
Sidebar 1.1 Some Infamous Reliability Problems*
* References to learn more about these cases are provided at the end of the chapter.
In September 2016, Samsung recalled 2.5 million Galaxy Note 7 smartphones after reports of large numbers of phones catching fire due to faulty batteries. Studies showed that the problems were caused by a combination of inadequate design and manufacturing flaws.
The National Highway Traffic Safety Administration (NHTSA) in 2015 recalled 28 million vehicles equipped with Takata airbags due to inflators rupturing during deployment. Data analysis showed that older airbags and those in regions with high temperatures and humidity, such as the Gulf Coast, were up to ten times more likely to rupture. It was determined that moisture could penetrate the inflator canister and make the propellant more explosive over time.
In 2007, DaimlerChrysler had to recall over 270,000 minivans in regions in the U.S. where roads are salted heavily during the winter to avert icing. Salting tends to corrode airbag sensors, thus preventing the airbag from deploying when needed. The affected sensor components were replaced.
Rollovers in the late 1990s of Ford Explorer sport utility vehicles equipped with Bridgestone/Firestone tires, resulting in the loss of numerous lives. After a lengthy investigation, it was determined that a design change introduced by the tire manufacturer played a key role in leading to the rollovers.
Many other reliability failures do not make the news, and do not have disastrous consequences, but still cause customers appreciable inconvenience and/or cost companies large amounts of money in warranty and possibly product recall costs, as well as much goodwill, negatively affecting future sales. The penchant for reliability sends a clear message to manufacturers that wish to delight customers, earn their repeat business, have them recommend the product to friends, and avoid lawsuits. A key lesson learned is the importance of gaining an understanding during product design of the environments in which the product might be required to operate and how this might affect its performance and reliability. However, this is usually easier said than done. In applications, both reliability measurement and reliability assurance pose some unique challenges.
A careful study of field reliability issues, such as those described in Sidebar 1.1, usually suggests the right data and analyses at the right time, coupled with prompt action, could have avoided—or at least appreciably mitigated—the severity of the problem. Much of this book is devoted to describing how statistical tools are used to help ensure high product reliability, based upon the collection and analysis of the relevant data. In practice, the hard part of such evaluations is not the statistical analysis, but getting the “right data” in the first place. Thus, a key goal in statistical reliability assurance is to help ensure that the right data are being collected and appropriately kept throughout the process. Even though opportunities for acquiring large quantities of data on units in the field have advanced tremendously in recent years with the evolution of automated measurement systems, there are still challenges. Practitioners expend much effort, often with a limited payoff, in trying to understand and to compensate for poor data. Sidebar 1.2 provides a striking illustration of the undesired consequences of insufficient data and not paying enough attention to the data that were available.
Sidebar 1.2 The Challenger Space Shuttle Failure
The Challenger space shuttle was scheduled for launch on the morning of January 28, 1986. According to the Rogers Commission (1986) that subsequently investigated the launch, on the evening of 27 January, the risk posed to next morning’s planned launch by the predicted launch temperature of 30°F was discussed during a three-hour teleconference between engineers and managers from NASA and NASA’s contractor, Morton Thiokol. Low temperature was believed by some to increase the risk of failure of the O-rings that were used in critical joints of the solid rocket motor during launch. Most of the 24 previous launches had been at temperatures between 65°F and 77°F, with the lowest at 54°F.
Based upon the analysis of the data presented to them on O-ring failures during past launches, NASA management concluded that the probability of launch failure was in the order of one in a hundred thousand (engineering estimates were one in a hundred). Based on this evaluation and despite a strong recommendation not to launch from some of its engineers, Morton Thiokol acquiesced and the launch proceeded the next morning.
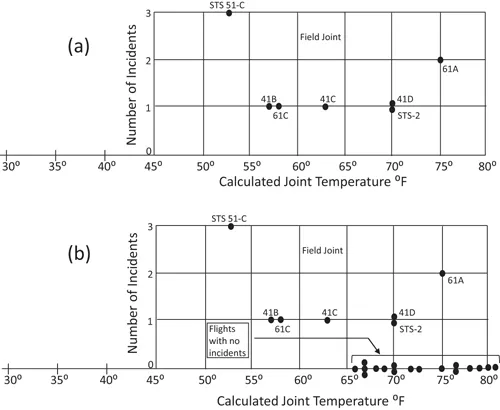
A subsequent review determined that the pre-launch analysis of the available O-ring data, as presented to management, was inadequate and erroneous. There was only a handwritten list of the dates of O-ring failures, the number of such failures, and the temperature. No plots of the data were presented. Most importantly, the “analysis” completely ignored information from the previous launches for which there were no O-ring failures. In particular, analyses omitting this information provided no clear evidence of a relationship between temperature and O-ring failure. However, when the data on the launches without any O-ring failures are correctly included in the analysis, a strong association between temperature and O-ring failure probability is evident. This is illustrated by Figures 1.1a and 1.1b, adapted from plots in the Rogers Commission (1986) report. Figure 1.1a is a plot of the number of failures per flight versus launch temperature excluding the flights with no failures. This limited data plot shows no clear evidence of a relationship between temperature and O-ring failure. Figure 1.1b shows all the data, including the flights with no failures. This plot suggests a strong association between temperature and the number of O-ring failures, with low temperatures being particularly risky.
FIGURE 1.1 Plots of the number of O-ring failures per flight versus launch temperature, (a) excluding and (b) including flights with no failures. The labels on the points indicate flight numbers. These figures were adapted from the Rogers Commission (1986) report. We extended the temperature axes to include the forecast temperature of 30°F for the planned launch.
There were two O-rings at each of six field joints in the space shuttle’s solid rocket motors. If only one of these O-rings failed at any location, it would not be a problem. If both failed at one location, it would be catastrophic. In the January 28, 1986 Challenger launch, both O-rings failed in one of the field joints. A subsequent careful statistical analysis of all the available data (Dalal, Fowlkes, and Hoadley, 1989) estimated the risk of failure for a 31°F launch to have been at least one in eight.
The Challenger shuttle disaster was, at least in part, attributable to obtaining insufficient data and not paying enough attention to the data that were available. It also illustrated the usefulness of appropriate plots of the data. Finally, it highlights the importance of the skills that engineers and statisticians must possess in order to communicate complex technical matters to upper-level management.
In this chapter, we
Define reliability and the challenges associated with reliability measurement and assurance.
Describe the recent shift from a reactive to a more proactive mindset in reliability assurance.
Discuss the evolving role of statistics in helping improve reliability throughout the product life cycle.
1.2 What Is Reliability?
Reliability has informally been referred to as both “failure avoidance” and “quality over time.” A field reliability problem is one that results in the product failing to perform its intended function, as experienced by the customer, over time. For example,
You bought a new car and on your first drive, it started to drizzle. Muc...
Table of contents
Cover
Half-Title
Series
Title
Copyright
Contents
Preface
Acknowledgments
Authors
CHAPTER 1 ▪ Reliability and the Role of Statistics: An Introduction
CHAPTER 2 ▪ System Reliability Evaluation of a Conceptual Design
CHAPTER 3 ▪ Product Reliability Development
CHAPTER 4 ▪ Reliability Validation
CHAPTER 5 ▪ Reliability Assurance in Manufacturing
CHAPTER 6 ▪ Field Reliability Tracking
CHAPTER 7 ▪ A Peek into the Future
CHAPTER 8 ▪ Statistical Concepts and Tools for Product Lifetime Data Analysis
INDEX
Frequently asked questions
Yes, you can cancel anytime from the Subscription tab in your account settings on the Perlego website. Your subscription will stay active until the end of your current billing period. Learn how to cancel your subscription
No, books cannot be downloaded as external files, such as PDFs, for use outside of Perlego. However, you can download books within the Perlego app for offline reading on mobile or tablet. Learn how to download books offline
Perlego offers two plans: Essential and Complete
Essential is ideal for learners and professionals who enjoy exploring a wide range of subjects. Access the Essential Library with 800,000+ trusted titles and best-sellers across business, personal growth, and the humanities. Includes unlimited reading time and Standard Read Aloud voice.
Complete: Perfect for advanced learners and researchers needing full, unrestricted access. Unlock 1.5M+ books across hundreds of subjects, including academic and specialized titles. The Complete Plan also includes advanced features like Premium Read Aloud and Research Assistant.
Both plans are available with monthly, semester, or annual billing cycles.
We are an online textbook subscription service, where you can get access to an entire online library for less than the price of a single book per month. With over 1.5 million books across 990+ topics, we’ve got you covered! Learn about our mission
Look out for the read-aloud symbol on your next book to see if you can listen to it. The read-aloud tool reads text aloud for you, highlighting the text as it is being read. You can pause it, speed it up and slow it down. Learn more about Read Aloud
Yes! You can use the Perlego app on both iOS and Android devices to read anytime, anywhere — even offline. Perfect for commutes or when you’re on the go. Please note we cannot support devices running on iOS 13 and Android 7 or earlier. Learn more about using the app
Yes, you can access Achieving Product Reliability by Necip Doganaksoy,William Q. Meeker,Gerald J. Hahn in PDF and/or ePUB format, as well as other popular books in Technology & Engineering & Probability & Statistics. We have over 1.5 million books available in our catalogue for you to explore.