This fascinating book gives readers an appreciation of how biomedical research should work and how the reality is all too often seriously flawed. Explaining the logical basis of the different research approaches used by biomedical research scientists and their relative merits, it will help readers to make more realistic appraisal of media reports linking aspects of lifestyle, environment or diet to health outcomes and thus judge whether such claims are a real effect worthy of consideration for behavior change or deserving of further research resources.
Key features:
increases awareness of research fraud and some of the characteristics of fraudulent science and scientific fraudsters
shows that whilst outright fraud may be uncommon, fudging of results to help achieve statistical significance may be more prevalent
incorporates real-life case studies highlighting some of the infamous cases of research fraud and major scientific mistakes and the impact that they have had
provides a convenient overview of the research process in the biomedical sciences, with a focus on research strategy rather than individual methods
find supplemental detail on the author's blog https://drgeoffnutrition.wordpress.com/about/
By raising awareness of the possibility that research data may have been dishonestly generated and outlining some of the signs and symptoms that might suggest data fabrication, Error and Fraud: The Dark Side of Biomedical Research will help students and researchers to identify the strengths and limitations of different research approaches and allow them to make a realistic evaluations of their own and others' research findings.
Trusted by 375,005 students
Access to over 1.5 million titles for a fair monthly price.
The end result of most biomedical research studies is one of the following:
A comparison between the means of variables measured in different groups, e.g. in control and test groups
A comparison between some measure of relative risk in different groups, e.g. the relative risk of lung cancer in non-smokers and smokers (perhaps subdivided according to level of tobacco usage)
A comparison of the frequency of occurrence of some variable in different groups, e.g. the frequency of a potential side effect recorded in those given a drug or placebo
The association or correlation between two variables
Scientists use statistical analysis to make objective judgements about whether any differences or correlations are likely to be significant or just due to chance. If a large group of 15-year-old children were divided in half by alphabetical order, then the average heights of the two groups would almost certainly not be exactly the same. If one divided them according to sex, then the difference between average heights of the two groups would probably be bigger and the male average higher. Statistical analysis should indicate that any small difference between the alphabetically selected groups was just due to chance but that the difference between sexes was significant because adolescent boys tend to be taller than girls.
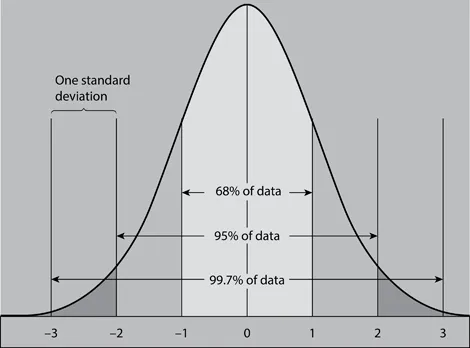
Even if subjects are matched for factors like age and sex, most biological variables are normally distributed around a mean or average value. If a frequency distribution is plotted, then this yields a so-called bell-shaped curve; lots of values are clustered close to the mean and the number of values decreases as you get further away from the mean on either side. The standard deviation describes the distribution of values around the mean in a normal distribution: about 68% values lie within one standard deviation either side of the mean, about 95% within two standard deviations and 99.7% within three standard deviations of the mean (see Figure 1.1).
Figure 1.1The frequency of values around the mean (0) in a normal distribution.
This means that in a large sample of British men, only about 2.5% would be taller than the mean/average plus two standard deviations and just 0.15% taller than the mean or average plus three standard deviations. If a survey revealed that 25% of children in an area were more than two standard deviations below the national average height, this would indicate that some factor was adversely affecting the growth of this group. Individual values for any variable that are much more than three standard deviations above or below the mean might indicate that this has a pathological cause.
Using the means, standard deviations and sample sizes of a measurement made on two groups, it is possible to estimate the probability that any difference between the means of the two groups is just due to chance (e.g. using a “t” test). If the likelihood of the difference occurring by chance is say 1:1000, then one would be confident that this was a real difference and this result would be classified as highly significant, i.e. p (probability) = 0.001 or 0.1%. If the probability was say 1:2 (p = 0.5), then this would be classified as a non-significant difference between the two means because one would expect to get a difference of this magnitude every second time simply by chance. By convention, scientists take a probability of less than 1:20 (p < 0.05 or 5%) as statistically significant. Of course, statistically significant differences can still occur by chance; theoretically once in every 20 comparisons. This means that if one does multiple comparisons on two groups then this increases the risk of false positive results. If a treatment has a “real” effect upon an outcome measure, then whether or not a test achieves statistical significance will depend upon:
The magnitude of the treatment effect
The general variability in the outcome measured and any variability in the response to the treatment
The size of the sample
A statistically significant difference between control and experimental treatments could also be the result of bias in the design or conduct of the experiment rather than a real effect of the treatment under test. For example:
Some bias in the way the two groups were initially selected
Bias in the way the control and experimental groups were treated during the experiment
A bias in the way outcome was measured in the two groups
When designing an experiment, it is possible to predict the sample size that is needed to produce a statistically significant result (i.e. p < 0.05 or <5%), if the intervention alters the measured variable by a given amount, e.g. what sample size one would require to show significance if a drug reduced blood pressure by say 20%?
Statistics may tell us that two means are probably different, but this may not be a clinically significant difference. An intervention may alter a measured clinical indicator significantly, but this does not necessarily mean that the patient gets any real benefit from the intervention. For example, if an intervention lowers blood cholesterol by a small but statistically significant amount in short-term trials, will this be of any clinical benefit to patients? Will the fall in blood cholesterol make a real difference to heart attack risk and will it be maintained over the longer term? The magnitude of the effect or degree of patient benefit from an intervention may be more important than the probability value; something can have a small and not clinically useful effect that is nonetheless statistically significant.
Association between variables
Biomedical scientists, particularly epidemiologists, often look for associations between variables:
Is there any relationship between saturated fat intake and blood cholesterol concentration?
Is there any association between salt consumption and blood pressure?
Is there any association between activity level or fitness and body fatness?
Is there any association between level of cigarette smoking and lung cancer risk?
Is there any association between fruit and vegetable consumption and mortality from cardiovascular disease?
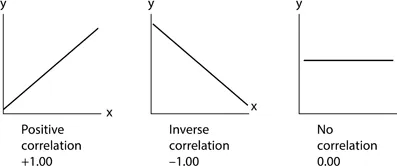
When testing the relationship between biological variables that one expects to be normally distributed, one can calculate a value known as the (Pearson) correlation coefficient (r). If the two variables are plotted on the x- and y-axis of a graph and if they lie on or equally scattered around a perfect straight line with a positive slope (i.e. increases in x are associated with increases in y), then this is a perfect positive correlation and r = +1. If the straight line has a negative slope (y decreases as x decreases) then this is a perfect negative correlation and r = −1. If all the points are on or evenly scattered around a horizontal line, then this means that there is no correlation between the measures on the x- and y-axis and r = 0 (shown in Figure 1.2).
Figure 1.2Interpreting correlation coefficients.
As with differences between means, one can assess the probability of a measured association being due to chance. The threshold for statistical significance of r values between 0 and +1/−1 depends upon the sample size. The threshold r (p = 0.05) is 0.6 with 10 pairs of values, 0.3 with 30 pairs, around 0.17 with 100 pairs and with 1,000 pairs an r of just 0.05 would be significant. Even though low r values may be statistically significant, the association between x and y is only a very weak one. If one squares the r value, this indicates how much of the variation in y is explained by variation in x. With r values of +1 and −1 then r2 is 1 and so 100% of the variation in y can be explained by variation in x, for other values:
r value (+ or −)
r2
Variation in y explained by variation in x
1
1
100%
0.7
0.49
49%
0.5
0.25
25%
0.2
0.04
4%
0.1
0.01
1%
As noted above, an intervention may have a statistically significant effect on a measured clinical indicator that is not clinically useful. Likewise, a weak correlation can be statistically significant without being of much value to a medical researcher trying to apply it practically, e.g. a weak association between a lifestyle factor and a disease risk factor. A significant correlation coefficient indicates that two variables are associated but does not necessarily mean that changes in x cause changes in y. Overlooking this mantra that association does not mean cause and effect is probably the biggest weakness in the interpretation and analysis of epidemiological findings and is discussed at length in Chapter 3.
When looking at potential causes of disease, then it is common to calculate something called the relative risk. In its simplest form, this is the incidence of disease in a group exposed to a potential cause of the disease divided by the incidence in the unexposed group, e.g. the incidence of lung cancer in cigarette smokers divided by the incidence in non-smokers. In this example, the relative risk may be well over 10, i.e. habitual smokers are ten times as likely as non-smokers to develop lung cancer. One could calculate relative risk at different levels or durations of smoking and expect to see a graded increase in relative risk with increased exposure. One might also compare relative risk in ex-smokers, non-smokers and current smokers. Such epidemiological studies can only demonstrate association but in this case the relative risk is so large and consistent across different types of studies that it was accepted fairly quickly that this association was almost certainly causal. The interpretation of small apparent increases in relative risk is discussed in Chapter 3.
This is the traditional model of scientific investigation; an observation generates a hypothesis and an experiment is designed to test this hypothesis. In his famous 1854 cholera study, John Snow noted that cases of cholera during an outbreak in Soho, London, tended to be clustered around a particular water source, the Broad Street pump. Cases also occurred in people who lived outside this pump's normal catchment area but nevertheless got their water from this pump; people who lived within this catchment area but had an alternative water supply were usually not affected. From these observations, he hypothesised that water from this pump was the source of the infection and removal of the pump handle was the intervention that confirmed this hypothesis.
Biomedical researchers now have a range of sophisticated observational and experimental methods available to help establish the causes of a disease and the effectiveness of potential treatments. The key difference between an observational study and an experiment is that an experimenter imposes some constraint or intervention to see if this produces the result predicted by the hypothesis. Experiments usually compare the outcome measure in control and test groups or control and test periods within the same group. Experiments are designed with the aim of ideally making the intervention the only consistent difference between control and experimental groups or periods. ...
Table of contents
Cover
Half Title
Title Page
Copyright Page
Dedication
Contents
Preface
Prologue
Acknowledgements
1 Research strategies in the biomedical sciences
2 Case studies of scientific errors
3 More general concerns about scientific credibility
4 The accused – case studies of scientists accused of research misconduct
5 Research fraud overview
6 Protection – barriers to the publication of fraudulent data
7 Detection: identifying fraud after publication
8 Disinfection and measures for minimising the impact of research fraud
Index
Frequently asked questions
Yes, you can cancel anytime from the Subscription tab in your account settings on the Perlego website. Your subscription will stay active until the end of your current billing period. Learn how to cancel your subscription
No, books cannot be downloaded as external files, such as PDFs, for use outside of Perlego. However, you can download books within the Perlego app for offline reading on mobile or tablet. Learn how to download books offline
Perlego offers two plans: Essential and Complete
Essential is ideal for learners and professionals who enjoy exploring a wide range of subjects. Access the Essential Library with 800,000+ trusted titles and best-sellers across business, personal growth, and the humanities. Includes unlimited reading time and Standard Read Aloud voice.
Complete: Perfect for advanced learners and researchers needing full, unrestricted access. Unlock 1.5M+ books across hundreds of subjects, including academic and specialized titles. The Complete Plan also includes advanced features like Premium Read Aloud and Research Assistant.
Both plans are available with monthly, semester, or annual billing cycles.
We are an online textbook subscription service, where you can get access to an entire online library for less than the price of a single book per month. With over 1.5 million books across 990+ topics, we’ve got you covered! Learn about our mission
Look out for the read-aloud symbol on your next book to see if you can listen to it. The read-aloud tool reads text aloud for you, highlighting the text as it is being read. You can pause it, speed it up and slow it down. Learn more about Read Aloud
Yes! You can use the Perlego app on both iOS and Android devices to read anytime, anywhere — even offline. Perfect for commutes or when you’re on the go. Please note we cannot support devices running on iOS 13 and Android 7 or earlier. Learn more about using the app
Yes, you can access Error and Fraud by Geoffrey Webb,Geoffrey P. Webb in PDF and/or ePUB format, as well as other popular books in Medicine & Biostatistics. We have over 1.5 million books available in our catalogue for you to explore.