![]()
CHAPTER 1
Introduction
“I for one welcome our new computer overlords” was the response of Ken Jennings in 2011 as he ceded his Jeopardy crown to IBM’s Watson, a Data Science-driven machine. Given the sophistication of Jeopardy’s prompts, both phrasing and content, it seemed that humans were on the verge of being automated away. And yet, almost a decade later, there is not one robo-CEO, or even a robotic Head of regional marketing. In fact, the list of successful corporate Data Science programs is short; there are only a few categories of operational tasks that have benefitted. Worse, though most companies are reluctant to admit it, most corporate Data Science projects fail entirely.
Having served as a long-term consultant for various Fortune 500 companies across a variety of sectors, overseeing data-driven projects of all types spanning from mergers to marketing, I’ve detected a pattern that differentiates successful Data Science programs from failures. I’ve also served as Chief Data Scientist for a successful startup in the real estate data analytics space, and the patterns hold here as well, suggesting a very broad generality across scale. I have been the hands-on-keyboard data scientist, been the leader of Data Science teams, and been the business-focused project leader interacting with executives, middle-management, and end business operators. And my conclusion is that the primary gap isn’t insufficiently fancy algorithms or raw computing power, but rather a gap of knowledge between the data scientists (who understand math and not business) and the business executives (who understand their businesses but none of the Data Science). A successful Data Science program must not merely contain both of these personas on the team, but actually exchange some understanding so an overlap exists within each team member’s brain.
Data Science was sold as a panacea, a set-it-and-forget-it commodity, a “click here to increase sales” button. The key word being “sold.” In conferences and pitch decks, executives were given access to only the highlight reels of Data Science, usually embellished a bit as well. Even I’ve contributed, as an entrepreneur, I recognized that part of my job as Chief Data Scientist was to answer the question “Yes, Potential Investor, we are indeed using all of the Machine Learning,” and then rattle off the latest buzzwords in a confident tone. We, in fact, were successfully employing Machine Learning in our scoring and suggestion algorithms, and I did try to be educational, but I still had to play into the preexisting narrative of the omnipotence of algorithms. And these algorithms can be powerful; Amazon’s product recommendation algorithm and Gmail’s spam filtering are competitive advantages. But the reasons for the success weren’t just in deploying the latest sci-fi sounding technology (Machine Learning, Deep Learning, Artificial Intelligence), or even in hiring the world’s leading data scientists, but rather they were at the interface of those technical elements with the business itself—its data ecosystem and its business-specific people.
Takeaways for Chapter 1: Introduction
• Real-world outcomes of Data Science projects rarely match anticipated success.
• Successful Data Science projects require active understanding, participation, and leadership from business executives in addition to technical/analytical talent.
![]()
CHAPTER 2
What Is Data Science
Data Science encompasses a technological journey from statistics (dating to the 1700s) to the modern (circa 2020) embodiment of Artificial Intelligence.
Statistics: First, some terminology. For the last century, the closest technology to Artificial Intelligence (AI) was “statistics.” If you wanted to understand whether a higher price increase was associated with higher customer churn, or if the shipments to the Midwest were going on back-order more than in the East Coast, you would plot averages on a chart and observe the differences. Because natural variation always occurs, and may not always be meaningful (e.g., two regional branches might perform generally equivalently, but rarely will they have the exact same monthly sales), a rigorous analyst might look at how much fluctuation there is within the averages to determine whether the differences are significant—that is, unlikely to have happened by random chance fluctuations. However, most businesses rarely take such statistical caution.
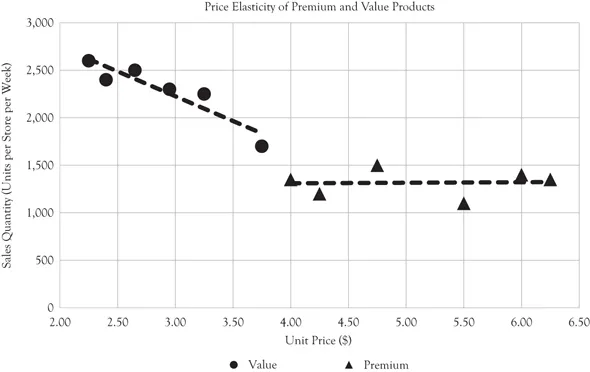
Figure 2.1 Price elasticity example
In this fictional example, natural variation in the pricing of two products (premium and value), possibly due to periodic promotional discounts, is plotted with the resulting sales at those price points. The premium product sales seem to be independent of the unit price, suggesting price inelasticity, whereas the value product sales are dramatically lower with high price point. Although statistical tests can determine whether these results are likely to be due to random fluctuations or truly represent elasticity, the human eye can see that the lines are compelling and the conclusion matches our intuition.
Simple plots like Figure 2.1 have one variable of interest that you believe might be a driver (such as price) and one outcome variable (sales quantity). Human eyes are great at analyzing these kinds of charts.
The trickiness comes from the fact that outcome variables like sales are never just the result of a single variable like price, rather there are dozens or hundreds of little factors driving sales up and down. One of the more common drivers include seasonality—toy sellers sell more toys at Christmas than in spring, so if you are trying to compare the effectiveness of a 25 percent discount promotion that ran in spring versus a 50 percent promo that ran at Christmas, you had better account for the seasonal difference, or you’ll mistakenly inflate the usefulness of 50 percent discounts. In fact, the charts in Figure 2.2 assume that the reasons we have data comparing different price points are merely because different prices were arbitrarily chosen, like experiments, whereas in reality, the company may have deliberately changed pricing strategies as a result of changing business circumstances that themselves are “hidden” potential key variables causing the observed results. Business analysts generally try to account for the key variables by segmenting, which unfortunately multiplies the number of charts beyond what a human can simultaneously comprehend, so this approach works when only a few key drivers are needed to understand the outcome.
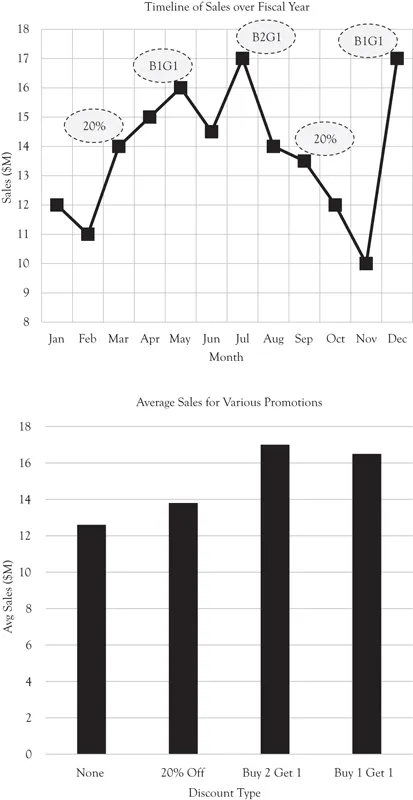
Figure 2.2 Discount promotions example
In this fictional example, promotional discounts of various severity were given on certain months and resulting sales are plotted. Although a simple average of sales when the promotions are in-play suggests that all promotions are better than None and that Buy 2 Get 1 (B2G1) is superior, an inspection of the timeline shows that seasonality likely influenced the results. Sales seem to be generally higher in summer than in winter, and Christmas may play an outsized role, obscuring the impact of promotions. Dissecting the various potential influences (promotions, seasonality, possibly others) can be difficult when there are limited examples and many variables are in play simultaneously.
Big Data: Then came a new term—“Big Data.” Big Data is big because it is granular. Companies like Walmart in the 1980s possessed Big Data, the list of all purchased items in their store annually was well into the millions, yet before the Big Data revolution, these sales logs were generally aggregated and summed into summary statistics that were easier for humans to comprehend and primitive computers to store. So the “big” refers to the transition toward analyzing data at that raw, granular, and transaction level. While a statistician would quickly convert the millions of transactions into a few averages, perhaps by day of week or by geography or price point—a visual chart that a human could easily interpret—the goal of Big Data was to inspect the granular subsections in combination (a given day of week, geography, and price point).
As number crunching skills and hardware became commonplace within organizations, granularity of analyses increased, and an analyst could even ask transaction questions like “What items are typically found in baskets together?” The resulting analysis might have millions of rows. For example, Walmart might ask “If a customer buys diapers, what is the probability that they also buy baby food?” The following are made up numbers, but let’s suppose 10 percent of customers buy diapers, 6 percent of customers buy baby food, and 5 percent of customers buy both diapers and baby food. A smart business analyst might have the intuition that these products are linked, verify by computing these statistics, and even offer an interpretation such as “I know from being a parent that every baby of diaper age is also a baby of baby food age, I would have expected all customers that buy one to buy the other.” The analyst might then observe that most but not all customers buying diapers also buy baby food, and perhaps even recognize that some of the discrepancy could just be that the products aren’t being bought at the same time. But the analyst would surmise that if too few diaper buyers also buy baby food, perhaps the company’s baby food offering is weak, causing shoppers to buy elsewhere. The analyst then decides to try discounting baby food with purchase of diapers to increase baby food sales.
In the era of Big Data, Walmart doesn’t need to wait for an experienced product manager to have a hunch about baby products. Walmart can simply compute all of the answers to “If a customer buys this product, what is the probability that the customer also buys that product.” Of course, if Walmart has 10,000 SKUs (“Stock Keeping Unit,” a term for unique items in its product catalog), then there are 10,000 × 10,000 = 10,000,000 combinations of items. But a computer has no trouble making 10 million comparisons and reporting the tightest conditional probabilities. Indeed, a computer can also compute all of the three-way combinations to really tighten the certainty (if a customer buys X and Y, they also buy Z on 673 out of 844 transactions, or 80 percent). A good business analyst would remind you not to put too much faith in the infrequent but highly correlated combinations (e.g., three people bought X and of them two bought Y, for 66 percent), and a statistician would be even more rigorous about defining those cutoffs.
Data Science: Data Science was statistics on steroids. But at this granular level, with so much formerly discarded or aggregated data now saved and available for anyone in the company to analyze, a new problem emerged. We don’t merely know the products in the basket, we actually recorded a lot more about each transaction—the time of day, the discount amount on the coupon used, and so on. We also recorded more information about the environment—the layout of the store at the time (Was the product at eye level? Were any similar products on sale at the time?). And further still, it became possible to buy even more data about possible driver variables—with the use of loyalty cards, you could track all past purchases, obtain demographics on the purchaser, even record the weather at that store at that day, or track how the stock market was performing.
But something goes wrong in statistics when you try to test too many driver variables at once. Firstly, no human can look at all these variables simultaneously, and the old trick of just making more charts blows up quickly into thousands of charts. But more insidiously, just by random chance, some variables are going to be tightly correlated with the outcome variable even though they didn’t truly drive anything.
For example, Figure 2.3 is a chart of the number of drugs approved each year by the U.S. FDA, and also plotted interest rates in Argentina per year for 2013 to 2017. A human eye would note the remarkable relationship, and even the computed correlation (also known as R2) is suggestive of some sort of nonrandom relationship between these variables. But we all know that the FDA and Argentine economy probably are not linked in any meaningful way. I produced this chart by starting with a time series for the number of FDA-approved drugs per year, then downloading a list of annual interest rates by country for the overlapping time period. I then checked all national interest rates against the FDA data to see if any had strong relationships. The problem is that I didn’t merely inspect Argentina; rather I looked at 200 interest rates simultaneously. Most countries, of course, had no relation with FDA approvals (further suggesting that the global economy has no relationship to the FDA), but I checked so many countries that one was likely to make a compelling chart just by random chance. We call this problem “overfitting.” Note that we only had five FDA data points; the trend goes up, then up again, then down, then up. If we pick a totally random variable like national interest rates, we don’t require its trend to do very much to get a great fit—just go up and down in the right sequence five times. If we had only tested one variable (Argentina on our first try), we’d be pretty convinced that Argentinian interest rates the FDA approval rate. But if we check 1,000 driver variables, we’re almost certain to find a perfect match (in fact, we should expect to find 30 driver variables that match). And I was only looking at interest rates, I could have looked at the weather in any number of places, or the attendance at sports arenas—literally anything—so if I kept trying to find explanations for the FDA approval rates, I would have found some very compelling charts and been fooled into believing the patterns were meaningful.
The risk of overfitting is likelier with small datasets. For example, in Figure 2.3, five years of data are shown. But what if we only had four years of data, perhaps the year is now 2016, and we only have data for 2013, 2014, 2015, and 2016. We would be looking for an explanatory variable that simply goes up once and then up again, then down. Assuming most variables go up and down at random, that means there’s a 50 percent chance of a variable going up from 2013 to 2014, a 25 percent chance of then also going up from 2014 to 2015, and a 12.5 percent chance of going down from 2015 to 2016. If we check a mere 10 candidate variables, we would expect at least one to match the pattern of FDA approvals (although not all would go up and down by similar amounts, rising quickly at first then slowing then dropping powerfully, but with enough drivers, eventually a perfect fit would be found). In many business settings, such a scenario is very likely—only a few years of data may exist since the database was replaced or collection methodology was changed significantly, and there are so many possible explanations that could be attempted. And business decisions are often ma...