Sensemaking in Safety Critical and Complex Situations: Human Factors and Design
Human factors-based design that supports the strengths and weaknesses of humans are often missed during the concept and design of complex technical systems. With the focus on digitalization and automation, the human actor is often left out of the loop but needs to step in during safety-critical situations. This book describes how human factors and sensemaking can be used as part of the concept and design of safety critical systems in order to improve safety and resilience.
This book discusses the challenges of automation and automated systems when humans are left out of the loop and then need to intervene when the situation calls for it. It covers human control and accepts that humans must handle the unexpected and describes methods to support this. It is based on recent accident analysis involving autonomous systems that move our understanding forward and supports a more modern view on human errors to improve safety in industries such as shipping and marine.
The book is for human factors and ergonomists, safety engineers, designers involved in safety critical work and students.
Stig Ole Johnsen is a Senior Researcher at SINTEF in Norway. He has a PhD from NTNU in Norway with a focus on resilience in complex socio-technical systems and has a Master's in Technology Management from MIT/NTNU. He chairs the Human Factors in Control network (HFC) in Norway to strengthen the human factors focus during development and implementation of safety critical technology. His research interests include meaningful human control to support safety and resilience during automation and digitalization.
Thomas Porathe has a degree in Information Design from Malardalen University in Sweden. He is currently Professor of Interaction Design at the Norwegian University of Science and Technology in Trondheim, Norway. He specializes in maritime human factors and design of maritime information systems, specifically directed towards control room design, e-navigation and autonomous ships. He has been working with e-Navigation since 2006 in EU projects such as BLAST, EfficienSea, MONALISA, ACCSEAS, SESAME and the unmanned ship project MUNIN. He is active in the International Association of Aids to Navigation and Lighthouse Authorities (IALA).
Trusted by 375,005 students
Access to over 1.5 million titles for a fair monthly price.
In the Beginning, HMI Evolved as Technology Became Available
First, Computer Interfaces Were Mere Copies of the Hardware Solutions
No Human Factors or Ergonomics Were Considerations in the Design
Lack of Philosophy and Style Guides
The Lack of a Hierarchy Required Many Screens to Provide an Overview
The Power of the Computer Allows an Increase in Scope of Control
Control Rooms and SA Have Not Necessarily Evolved with the New HMI
Current Good Practices for Designing HMI
References
This section gives a short introduction on how human–machine interfaces (HMI) have evolved: from analogue instruments (such as gauges) local to the plant equipment to centralized computer-based control systems enabling control of complex operations. Knowledge of how to provide a performance-based design between the human operator and the computer system is required to reduce the risk of accidents. At the end of this chapter, a few suggestions on good practices related to HMI design and how to deliver a good Return On Investment (ROI) from an HMI upgrade are provided.
In the Beginning, HMI Evolved as Technology Became Available
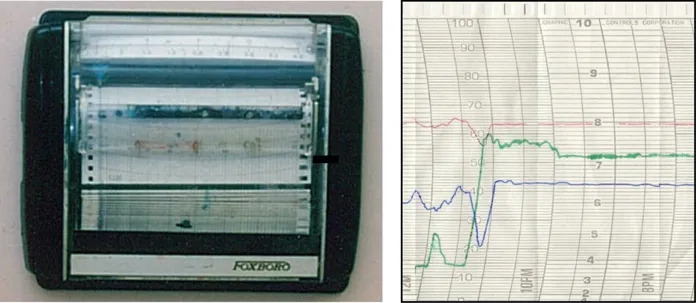
HMI have been evolving for the last 50 years. In the early days of instrumentation, the HMI was local to the instrument, for example, a pressure gauge, a temperature bulb, a level indicator. As instrument signals extended over greater distances to the local control room, local control room indications were provided and collected together onto an instrument panel. These were still gauges, but some were collected into charts. Some signals now provided process values (PVs) to pneumatic controllers and resulted in PID (proportional–integral–derivative) control of valves and other devices (Figure 1.1).
FIGURE 1.1 Pneumatic controller.
A PID controller is a control loop using feedback that is widely used in industrial control systems. A PID controller continuously calculates a deviation as the difference between the desired setpoint and a measured process variable and applies an error correction based on proportional, integral, and derivative algorithms.
First, Computer Interfaces Were Mere Copies of the Hardware Solutions
Technology progressed, and instrumentation became a microprocessor with new capabilities and transmission over greater distances. They were eventually ending up connected to a computer through input and output cards. Signals became a mixture of analogue and digital. The visual display unit (VDU) became the host of the instrumentation displays, often copied from their pneumatic or electronic representation.
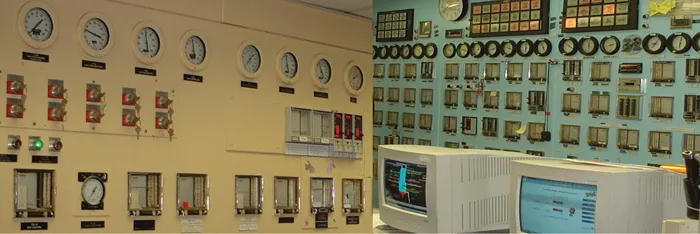
The pneumatic controls became obsolete and were replaced by individual electronic controls but in the same configuration as the pneumatic controls on a metal panel. This solution had many limitations due to space availability and transmission distance for the signal, which often was still pneumatic (Figure 1.2).
FIGURE 1.2 1950s pneumatic control panels.
A “current to pressure” transducer (I/P) converts an analogue signal to a proportional linear pneumatic output. The I/P converter provides a reliable means of converting an electrical signal into pneumatic pressure in many control systems. The “pressure to current” converters (P/I) converts a pneumatic signal to a proportional electrical output.
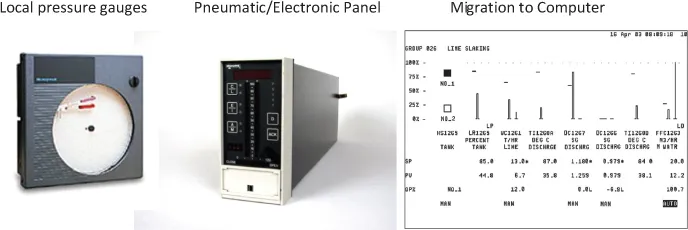
In the past, the HMI design of hardwired panels focused on optimizing the controls based on process adjustments to allow the operator to stand at one spot on the board and make moves to control the process. As computerized control became available, the very first version provided a direct copy of these controls with optimum grouping, as described below (Figure 1.3).
FIGURE 1.3 Evolution of controllers.
No Human Factors or Ergonomics Were Considerations in the Design
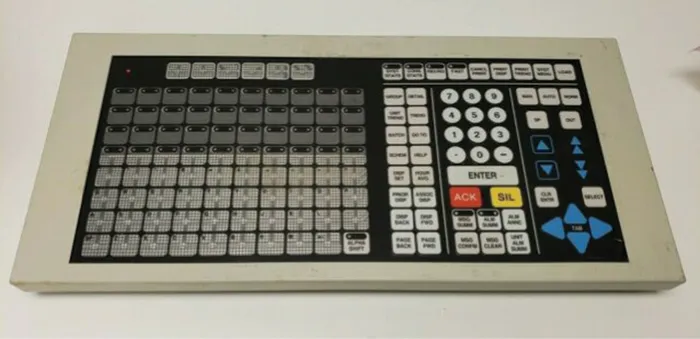
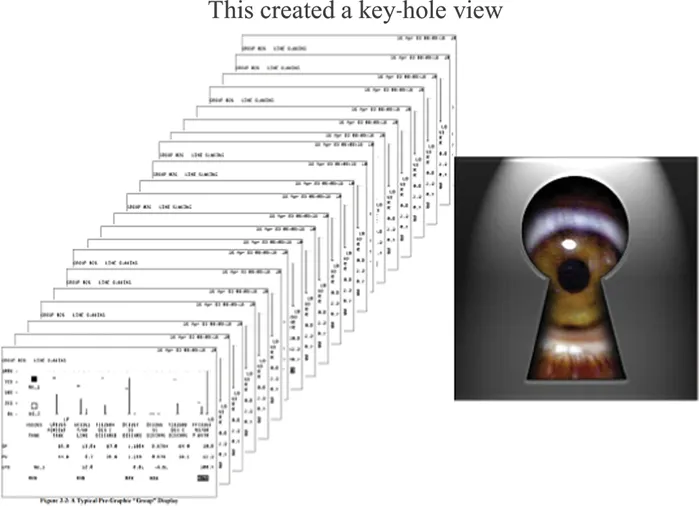
As the VDU evolved, it initially emulated the panel instrument displays. However, this became challenging as hundreds of pages of group displays (with eight single equivalent controllers) became available as more instrumentation was added to the process plants. There is a need to access relevant controllers based on alarm conditions. The operator keyboard shown in Figure 1.4 is designed to ease navigation to these groups, providing a quick indication of the pages with active alarms through function keys with alarm lights.
FIGURE 1.4 Operator keyboard. (Courtesy of Honeywell IAC.)
However, this gave you a key-hole view of the process and no total overview (Figure 1.5).
FIGURE 1.5 Hundreds of controller pages.
As technology became available and had more capability, a new graphic HMI presentation evolved, allowing more information to be added and displayed: The move from a page of 8 controller groups to new process display pictures on a black background using multiple colours to represent equipment and instrumentation values.
The industry did not spend any time deciding what to use for these displays. They observed engineers using two document types to interpret the process: a process flow diagram (PFDs) document that provided an overview of the process and on a more detailed level, the Process and Instrument Drawing (P&ID), including more details than a PFD documenting major and minor flows, control loops and instrumentation which became the main control system view of the plant.
Engineers quickly latched onto the P&ID and PFD diagram and broke them up into individual screens. Operators initially did not like them as they lost the optimization of controls being grouped on a page. They now experienced difficulty and navigation issues as operators had to find controllers on hundreds of P&ID pages and not grouped based on tasks as the previous design.
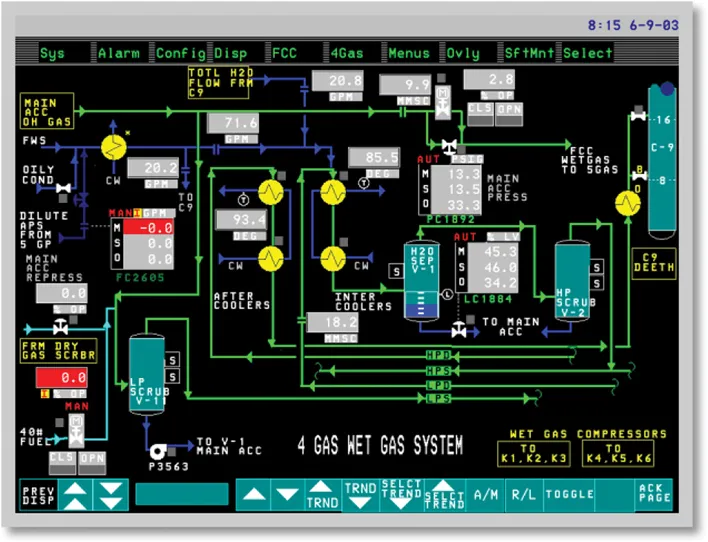
As the computer capabilities allowed, the HMI became a representation of the P&ID drawings, as shown in Figure 1.6, often creating many pages and a navigation nightmare (Figure 1.8). The screens were often colourful, with no human factor considerations.
FIGURE 1.6 Process and instrument drawing (P&ID) colourful display screen.
Because of the lack of human factor understanding, many mistakes that are well known today were common in the designs introduced in the early 1980s. For example, today, it is well known that people with a colour deficiency (colour blind) cannot discriminate between the colours red and green. These two colours were dominant in the HMI design and differentiated open (green) versus closed (red) and running (green) versus stopped (red). Colour is a coding system, and this HMI design produced coding systems that were compromised due to human limitations.
For example, the colour “Red” was used to represent the most critical high priority alarm colour and should remain reserved for this purpose on a graphic. However, as just discussed, it sometimes indicated the status of the valve positions and motor de-energized, and many other equipment states.
Colour is just one type of coding method. I have witnessed some graphics using “Red” for over 13 different codes, rendering it no longer a sensible coding system.
As an example of more acceptable coding, from a recent HMI project, we used line thickness instead of colour to portray different electrical line voltages for an electrical transmission centre overview display.
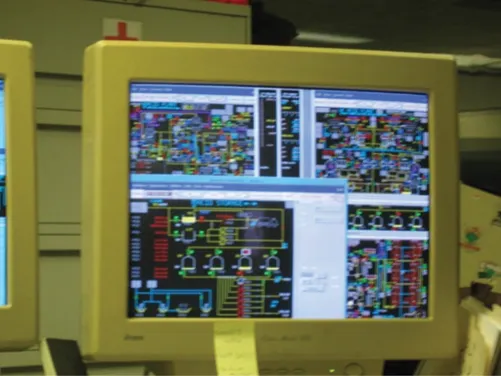
Lack of human factors and ergonomics knowledge also led to poor readability and lack of display graphics clarity. Incorrect viewing angles and distance from the user to the screen were challenges that were often ignored making readability and noticing a change impossible. In addition, the use of too small fonts, wrong font style, and too much information squeezed onto a display also hindered readability. Thus, sometimes viewing text and numbers contributed to poor display quality as seen in Figure 1.7.
FIGURE 1.7 Computer display screen with multiple P&ID)screens open on a single display.
Lack of Philosophy and Style Guides
The lack of philosophy and style guides allowed individuals to do what they thought was right, rather than following a consist...
Table of contents
Cover
Half Title
Title Page
Copyright Page
Table of Contents
Introduction
Contributions
Contributors
Chapter 1 Introduction, How HMI Has Been Evolving
Chapter 2 A Guide to Human Factors in Accident Investigation
Chapter 3 What Makes a Task Safety Critical? A Barrier-Based and Easy-to-Use Roadmap for Determining Task Criticality
Chapter 4 Making Sense of Sensemaking in High-Risk Organizations
Chapter 5 Prospective Sensemaking in Complex Organizational Domains: A Case and Some Reflections
Chapter 6 The Challenges of Sensemaking and Human Factors in the Maritime Sector – Exploring the Helge Ingstad Accident
Chapter 7 Addressing Human Factors in Ship Design: Shall We?
Chapter 8 Sensemaking in Practical Design: A Navigation App for Fast Leisure Boats
Chapter 9 Unified Bridge – Design Concepts and Results
Chapter 10 Supporting Consistent Design and Sensemaking across Ship Bridge Equipment through Open Innovation
Chapter 11 User-Centred Agile Development to Support Sensemaking
Chapter 12 Improving Safety by Learning from Automation in Transport Systems with a Focus on Sensemaking and Meaningful Human Control
Chapter 13 Application of Sensemaking: Data/Frame Model, to UAS AIB Reports Can Increase UAS GCS Resilience to Human Factor and Ergonomics (HF/E) Shortfalls
Chapter 14 Constrained Autonomy for a Better Human–Automation Interface
Chapter 15 HMI Measures for Improved Sensemaking in Dynamic Positioning Operations
Index
Frequently asked questions
Yes, you can cancel anytime from the Subscription tab in your account settings on the Perlego website. Your subscription will stay active until the end of your current billing period. Learn how to cancel your subscription
No, books cannot be downloaded as external files, such as PDFs, for use outside of Perlego. However, you can download books within the Perlego app for offline reading on mobile or tablet. Learn how to download books offline
Perlego offers two plans: Essential and Complete
Essential is ideal for learners and professionals who enjoy exploring a wide range of subjects. Access the Essential Library with 800,000+ trusted titles and best-sellers across business, personal growth, and the humanities. Includes unlimited reading time and Standard Read Aloud voice.
Complete: Perfect for advanced learners and researchers needing full, unrestricted access. Unlock 1.5M+ books across hundreds of subjects, including academic and specialized titles. The Complete Plan also includes advanced features like Premium Read Aloud and Research Assistant.
Both plans are available with monthly, semester, or annual billing cycles.
We are an online textbook subscription service, where you can get access to an entire online library for less than the price of a single book per month. With over 1.5 million books across 990+ topics, we’ve got you covered! Learn about our mission
Look out for the read-aloud symbol on your next book to see if you can listen to it. The read-aloud tool reads text aloud for you, highlighting the text as it is being read. You can pause it, speed it up and slow it down. Learn more about Read Aloud
Yes! You can use the Perlego app on both iOS and Android devices to read anytime, anywhere — even offline. Perfect for commutes or when you’re on the go. Please note we cannot support devices running on iOS 13 and Android 7 or earlier. Learn more about using the app
Yes, you can access Sensemaking in Safety Critical and Complex Situations by Stig Ole Johnsen, Thomas Porathe, Stig Ole Johnsen,Thomas Porathe in PDF and/or ePUB format, as well as other popular books in Psychology & Cognitive Psychology & Cognition. We have over 1.5 million books available in our catalogue for you to explore.